


Your web app feels quick on a developer laptop. The first screen appears, the test account signs in, and the demo looks polished. Then real traffic arrives. Personalization calls compete with analytics, a recommendation service waits on a database query, a third-party widget adds more JavaScript, and an AI feature keeps the interface busy long after the user has clicked.
That gap between a clean lab result and a sluggish production experience defines modern web app performance. Speed isn't just a matter of compressing images or choosing a faster framework. It depends on how browsers, APIs, databases, infrastructure, external services, and AI workloads behave together.
The practical answer is observability. Teams need to see where time goes, understand which dependencies create risk, and set limits before a feature reaches production. Administrative tools also help. A prompt management system, for example, can keep AI prompts versioned, database parameters controlled, and model activity logged instead of allowing every integration to become an untraceable bottleneck.
The Reality of Modern App Speed
A retail app can render its product grid quickly during development, then slow down when production users receive individualized recommendations, inventory updates, pricing rules, and behavioral content. The browser isn't handling one page anymore. It's coordinating a collection of data requests, scripts, components, and third-party services that all compete for attention.
The same pattern appears in fintech dashboards, healthcare portals, and media platforms. A user might open a page that needs authentication, account data, a permissions check, a chart library, a personalization decision, and an AI-generated explanation. Each dependency can look harmless in isolation. Together, they create a chain that delays rendering and blocks interaction.
Practical rule: Treat every new dependency as a performance decision, not just a product decision.
Network transfer still matters, but it no longer explains the entire experience. Large DOM trees, repeated client-side rendering, synchronous state updates, API latency, and third-party execution can all keep the main thread busy after the initial document arrives. A page may display something quickly and still feel broken because taps, typing, scrolling, or navigation respond late.
Why production behaves differently
Development environments usually have favorable conditions: fast hardware, warm caches, low concurrency, short data sets, and few real integrations. Production introduces slower mobile CPUs, variable networks, unusual user journeys, larger accounts, and services that occasionally respond slowly.
That's why a single Lighthouse score can't represent the complete health of an application. Lab tools are useful for reproducing controlled problems, but field monitoring reveals how real devices and traffic segments experience the product.
Full-stack observability connects those views. It links browser timings to server traces, API calls, database work, queue depth, errors, and external dependencies. Without that connection, engineers may optimize the visible symptom while the actual delay sits in a service several calls away.
The role of prompt management
AI features make this more urgent. A prompt can trigger retrieval, internal data access, model inference, validation, and a follow-up request. If prompts are scattered through application code, developers struggle to compare versions, inspect failures, or understand why one workflow consumes more resources than another.
A prompt management system provides an administrative layer for those operations. A prompt vault with versioning gives teams controlled changes, a parameter manager governs internal database access, and centralized logging makes activity across integrated AI services easier to trace. That doesn't make an AI workflow fast by itself. It makes performance behavior visible and manageable.
The right target isn't an impressive speed test on one machine. It's a responsive, predictable experience for the users and workloads that matter to the business.
Core Web Vitals and Backend Metrics
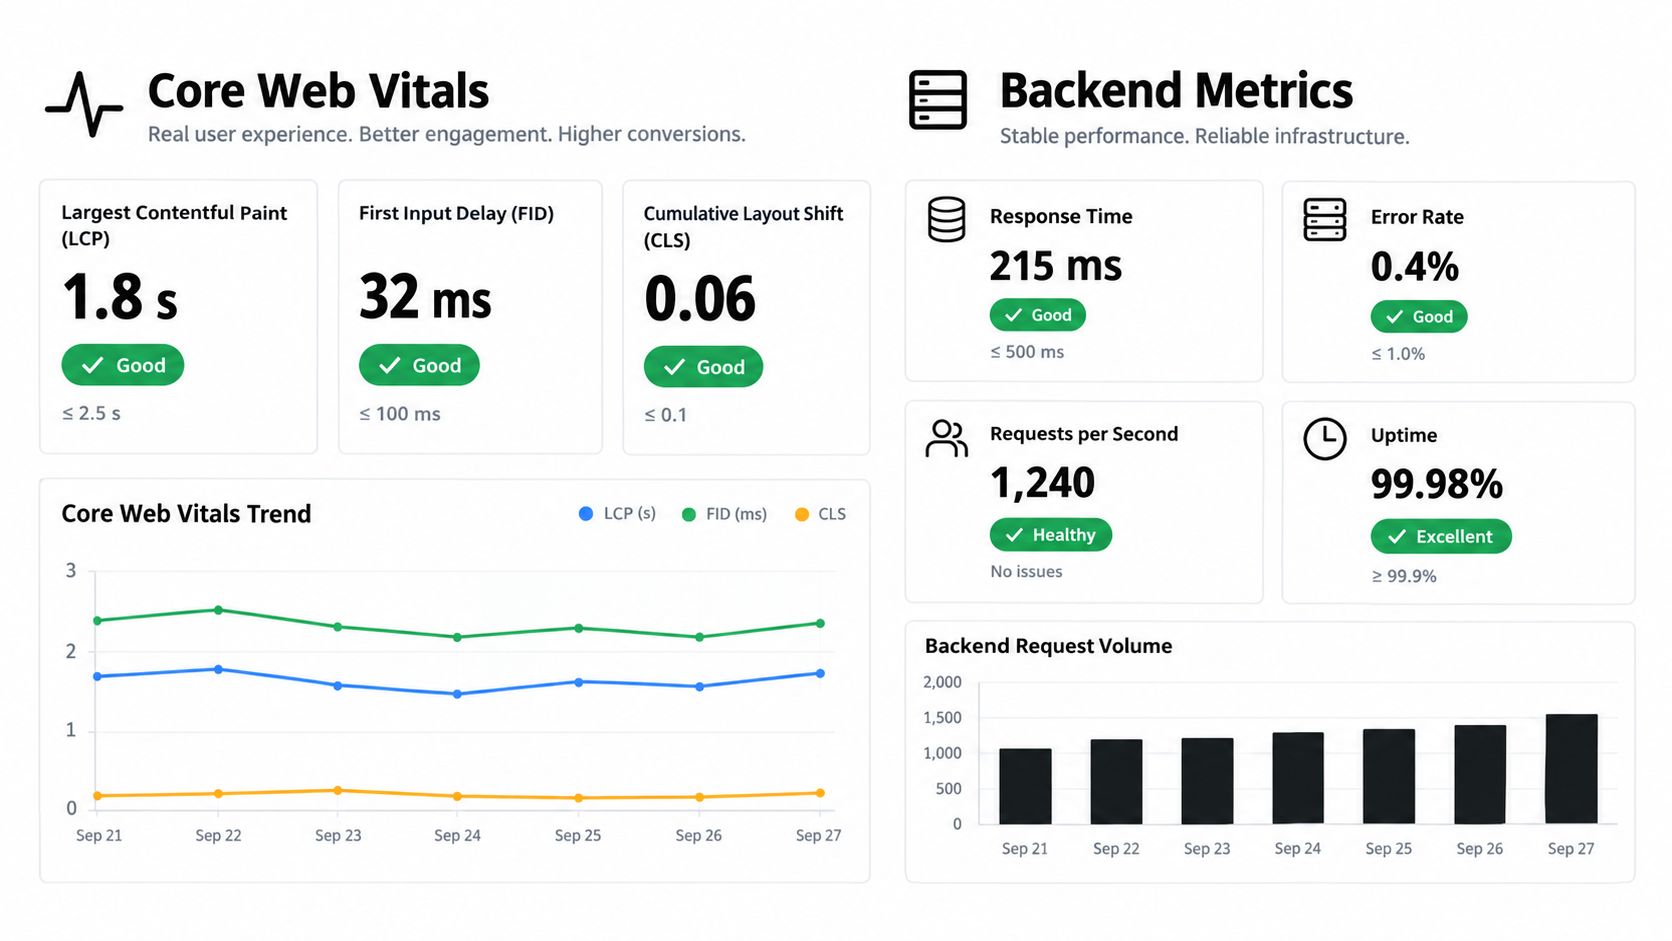
A useful performance review begins with a shared vocabulary. Google's Core Web Vitals focus on three user-facing outcomes: loading, responsiveness, and visual stability. Google evaluates them at the 75th percentile of real user page loads, as described in its Core Web Vitals documentation. That percentile matters because a fast internal test doesn't rescue an application that performs poorly for a substantial group of visitors.
- Largest Contentful Paint: A good result is 2.5 seconds or less. LCP reflects how quickly the largest visible content element becomes available, so render-blocking scripts, slow server responses, and unoptimized hero media can all affect it.
- Interaction to Next Paint: A good result is 200 milliseconds or less. INP replaced First Input Delay as a Core Web Vital, and it measures how promptly the page produces visual feedback after interaction. Long JavaScript tasks and expensive event handlers are common causes of failure.
- Cumulative Layout Shift: A good result is 0.1 or below. CLS captures unexpected movement, such as an image loading without reserved space or a dynamic module pushing content downward.
Frontend scores need backend context
Frontend metrics tell you what users feel, but backend measurements often explain why they feel it. Time to First Byte, or TTFB, shows how long the browser waits before receiving the first response bytes. API response time, error rate, and concurrency reveal whether a service can support the work the interface requests.
The gap between desktop and mobile field performance is substantial. In 2024, 54% of desktop websites had good TTFB, compared with 42% of mobile websites, according to the 2025 Web Almanac performance chapter. Mobile median Total Blocking Time rose to 1,916 milliseconds in 2025, up from 1,209 milliseconds in 2024, a 58% increase, in the same source. At the 90th percentile, mobile users experienced more than 7.5 seconds of blocking time before pages became fully interactive.
These figures show why a desktop-oriented lab run can mislead a team. A page can pass internal checks while mobile users wait through heavier main-thread work, slower APIs, and more constrained hardware.
For a practical audit workflow that pairs frontend diagnostics with implementation advice, the application performance guide offers a useful starting point. The AutoSEO web performance guide is another resource for teams reviewing Core Web Vitals issues and prioritizing fixes.
Set targets that reflect user journeys
Don't monitor only the landing page. Track the actions that create business value, such as signing in, searching, filtering, checking out, loading a patient record, or opening a media feed. A technically acceptable homepage doesn't compensate for a slow checkout or an unresponsive account screen.
Pair each journey with browser and service measurements. That combination tells you whether the problem is a blocked render, a long interaction task, a missing layout reservation, a slow API, or an unreliable dependency.
Identifying Root Causes of Performance Drops
Performance drops become easier to fix when engineers locate the layer responsible instead of treating the whole application as slow. Start with a trace from a real user action, then follow its path through the browser, gateway, service layer, database, queue, and external provider.
Start with the browser
Large content-rich applications often spend more time processing the interface than downloading it. Repeated reconciliation, oversized component trees, unnecessary rerenders, and synchronous updates can keep the main thread occupied. A user sees a button, clicks it, and receives no immediate feedback because unrelated work is still running.
Use browser profiling tools to find long tasks and expensive event handlers. Check which components rerender after a small state change, whether a list renders records that aren't visible, and whether third-party scripts execute during the critical interaction.
Virtualization is particularly effective for long lists, feeds, tables, and search results. Instead of placing every row into the DOM, the application renders only the visible window and recycles elements as the user moves. Research on web application rendering found that virtualization reduced render times by more than 90% across test cases and significantly improved responsiveness metrics, as documented in this study of rendering optimization.
Diagnostic question: Does the user need every item rendered now, or only the items visible in the current viewport?
Follow dependency chains
A slow interface can begin with a server-side dependency. An API may wait for a database query, which may wait for another service, which may call an AI provider. If monitoring records only the browser request, engineers see a large duration without knowing which dependency consumed it.
Distributed tracing solves that problem by carrying a request context through each service. Look for serial calls that could run concurrently, repeated requests for identical data, retries that amplify load, and third-party calls placed directly on the critical path.
Separate transfer from execution
A smaller JavaScript bundle helps only if execution is also controlled. An application can download modest resources and still stall because it parses, compiles, and runs too much code before allowing interaction.
Review these causes separately:
- Resource cost: Identify scripts, fonts, images, and data that the browser must download.
- Execution cost: Find parsing, compilation, layout, and scripting work on the main thread.
- Rendering cost: Inspect DOM size, layout recalculation, and repeated component updates.
- Dependency cost: Trace API calls, database waits, queues, and external integrations.
This breakdown prevents a common mistake: optimizing the network while leaving synchronous UI work untouched. It also gives product teams a clearer trade-off. A personalized feature may be valuable, but it shouldn't delay the first usable interaction unless its business value justifies that cost.
Optimization Techniques Across the Stack
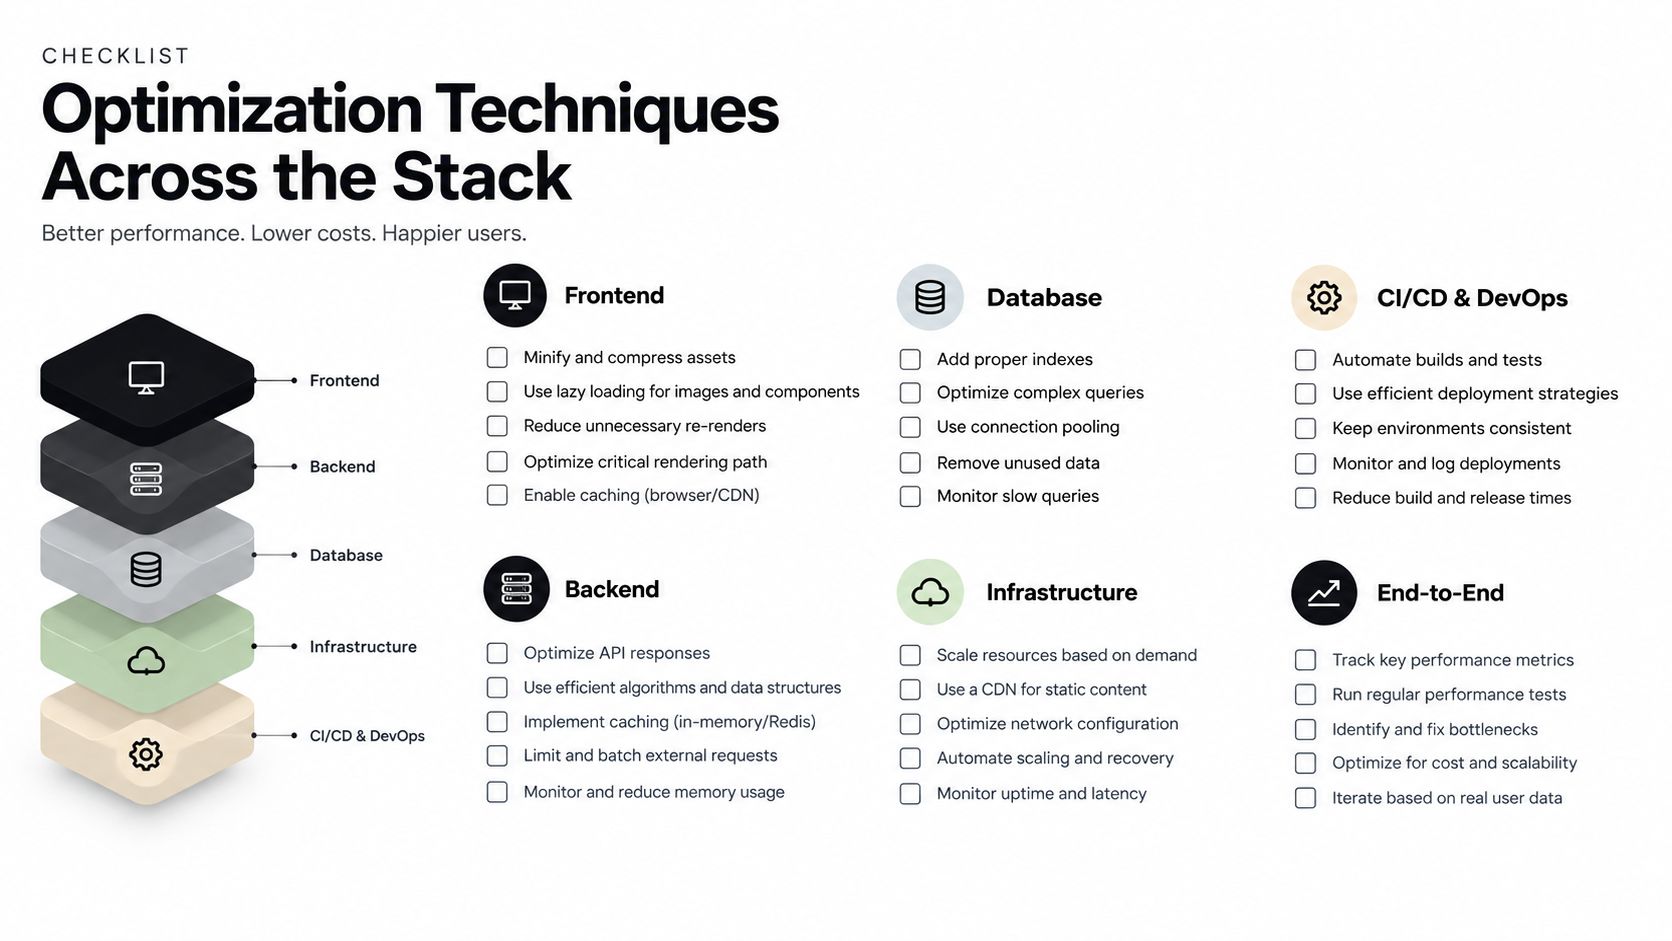
The best optimization depends on the bottleneck. A CDN won't repair a slow database query, database indexing won't reduce an oversized browser bundle, and autoscaling won't fix a component that blocks the main thread on every click.
Match the remedy to the delay
| Bottleneck | Useful intervention | Trade-off |
|---|---|---|
| Slow first rendering | Defer non-critical components, reduce render-blocking work, and use progressive hydration | Deferred features may appear later and need clear loading states |
| Heavy lists or feeds | Virtualize visible items and paginate data | Scroll behavior and accessibility require careful implementation |
| Static asset delivery | Use a CDN for cacheable assets and media | Invalidations and cache variation add operational complexity |
| Dynamic personalization | Use edge or hybrid execution where geography and data rules support it | Dynamic caching is harder because responses vary by user or context |
| Repeated backend work | Add intelligent caching, improve queries, and reuse connections | Stale data and invalidation rules must be explicit |
| Capacity pressure | Scale services horizontally and control concurrency | More infrastructure doesn't solve inefficient work |
Frontend work should protect the critical path. Load the shell and the content required for the first meaningful task, then hydrate secondary components progressively. Avoid sending a dashboard's complete interaction model before the user has opened the dashboard.
Backend optimization needs the same discipline. Inspect query plans, return only fields the interface needs, batch related reads, and prevent repeated calls inside loops. Connection pooling can reduce setup overhead, but poorly sized pools can also overwhelm a database, so capacity testing must accompany the change.
CDN, cache, or edge execution
A CDN is a strong fit for static assets and content that can be shared safely. It brings files closer to users and reduces repeated origin work. It isn't the right answer for every personalized response.
Caching works when the team can define the data's freshness and variation rules. Cache a product catalog differently from a private account balance. For dynamic content, an edge or hybrid approach can reduce geographic latency while keeping sensitive or complex decisions in controlled backend services.
Autoscaling handles changing demand, but it should be the final layer of a healthy design rather than a substitute for one. If every request triggers unnecessary computation, scaling only creates more expensive waste. Establish workload-aware limits, measure queueing and concurrency, and use load tests that resemble real user behavior.
The most effective sequence is straightforward: measure the slow path, remove unnecessary work, reduce critical-path dependencies, then add caching or capacity where the remaining demand requires it.
Scaling AI Features Without Breaking Speed
AI adds value by making applications more adaptive, but it also adds work that can be difficult to predict. A recommendation workflow may retrieve user data, construct a prompt, call a model, validate the result, and request supporting content. If that chain sits between a click and the next visual update, the interface inherits every delay.
The safest design treats AI as a workload with explicit boundaries. Render the core experience first, show a useful loading state, and let recommendations, summaries, or assistance arrive progressively when they aren't required to complete the user's immediate task.

Control the workflow, not just the model
A prompt management system helps engineering teams govern AI behavior as part of the application rather than hiding it in scattered code. Wonderment Apps' administrative toolkit includes:
- Prompt vault with versioning: Teams can manage approved prompt variants and compare changes without losing the previous configuration.
- Parameter manager: Developers can control parameters used for internal database access and reduce ad hoc data retrieval logic.
- Centralized logging: Logs across integrated AI services make latency, failures, and workflow paths easier to investigate.
- Cost manager: Entrepreneurs can see cumulative spend across AI integrations and connect usage decisions to operational planning.
That layer doesn't replace profiling. It gives profiling a better subject. Engineers can connect a slow user journey to the prompt version, retrieval parameters, model call, and response handling involved in that journey.
For broader implementation patterns, the AI-powered app development guide provides useful context on integrating AI into custom applications.
Choose asynchronous work deliberately
Not every AI response belongs in the critical path. A personalized explanation may load after the page becomes interactive. A classification used for fraud prevention may need to complete before a transaction proceeds. Those workflows require different latency budgets, fallbacks, and user messaging.
Keep these controls explicit:
- Fallback behavior: Show a deterministic result or a clear retry path when the model is unavailable.
- Concurrency limits: Prevent traffic spikes from creating an uncontrolled burst of model calls.
- Prompt discipline: Remove redundant context and retrieve only the data needed for the task.
- Response streaming: Use streaming when partial output improves the experience, but don't stream content that the user can't safely act on yet.
- Budget visibility: Track cumulative usage so a performance optimization doesn't quietly create an operational cost problem.
The goal isn't to make every AI call instant. It's to make the application's behavior understandable under normal usage, degraded dependencies, and peak demand.
Profiling Tools and Continuous Monitoring
Optimization expires. A framework update can change bundle behavior, a new analytics tag can add execution work, and a product release can turn a previously small API response into a heavy one. Continuous monitoring catches those changes while the context is still available.
Start with real user monitoring. Segment results by device class, geography, connection conditions, route, and user journey. Compare field data with lab traces so teams can reproduce a problem without mistaking a controlled test for the entire audience.
Build a full-stack telemetry path
A practical monitoring stack follows a request from the browser to the services behind it. Track:
- Browser experience: LCP, INP, CLS, TBT, navigation timing, long tasks, and memory behavior.
- Network and server delivery: Availability, DNS time, TTFB, response time, cache outcomes, and payload sizes.
- Application services: API response time, dependency duration, queueing, database time, and retries.
- Reliability and capacity: Error rates, concurrency, saturation, and failed background jobs.
- AI operations: Model latency, prompt version, retrieval work, failures, and cumulative spend.
Web application performance monitoring commonly combines frontend and backend mechanics, including TTFB, API response time, error rates, and concurrency. A web application performance monitoring guide describes API response time as baseline-dependent, identifies concurrent users as a core capacity metric, and lists an error rate under 0.1% as a useful target.
Turn measurements into operating rules
Metrics become useful when they trigger action. Define service-level objectives around critical journeys, then attach alerts to symptoms users recognize, such as a checkout request slowing, an account page returning errors, or an interaction becoming unresponsive.
A workable workflow looks like this:
- Capture a baseline: Record field and service behavior for important journeys before changing code.
- Profile the slow path: Use browser traces and distributed dependency tracing to locate the dominant work.
- Set a release budget: Limit critical JavaScript, payload weight, runtime work, and AI usage for each feature.
- Test under representative load: Include realistic data size, concurrency, third-party behavior, and mobile conditions.
- Monitor after release: Compare the new version with the baseline and alert on meaningful regression.
- Review ownership: Assign each metric to a team that can investigate and remediate it.
For teams selecting or organizing profiling tools, this performance monitoring tools overview can help connect browser diagnostics with broader operational monitoring. The important principle is continuity. A dashboard that nobody uses during releases is decoration, not observability.
Building for Predictable Scale
The strongest performance target isn't maximum speed in an artificial environment. It's predictability under load. An ecommerce shopper, a clinician reviewing a record, or a finance user approving a transaction needs the same essential workflow to remain responsive when personalization, integrations, and background processing become more demanding.
Build that predictability into the product lifecycle. Keep the initial render lightweight, virtualize large interfaces, trace dependencies, control cache variation, and separate optional AI work from critical interactions. Then monitor the system in production with field data, service telemetry, concurrency signals, error budgets, and AI cost visibility.
Business and engineering leaders can use a short review checklist:
- Can the team identify which dependency slowed a user journey?
- Are Core Web Vitals measured for real users rather than only lab devices?
- Does every AI workflow have a fallback and an owner?
- Are performance and AI usage budgets checked before release?
- Can the architecture scale by reducing work, not only by adding servers?
A durable app isn't one that wins a single benchmark. It's one that tells its operators what is changing, responds gracefully when dependencies degrade, and gives users a consistent path to complete important tasks.
Wonderment Apps helps organizations modernize legacy software, integrate AI into custom web and mobile applications, and build observable systems designed for scalable performance. Visit Wonderment Apps to discuss your application architecture, AI workload controls, and long-term engineering needs.