A lot of teams realize they need performance monitoring at the same moment their software becomes strategically important. The launch goes well, marketing does its job, usage climbs, and then the complaints start. Pages feel slow. Checkout hangs on certain devices. Support sees a spike in tickets, while engineering sees dashboards that still look mostly fine.
That gap matters. If leadership only sees uptime and infrastructure charts, they miss what customers are experiencing. If engineering only sees traces and logs, they can miss the business impact of a slowdown that hurts conversion, retention, or trust.
This gets even more complicated when AI enters the stack. A feature can be technically “up” while still feeling broken because model responses are delayed, expensive, inconsistent, or hard to debug across multiple services. That's why performance monitoring tools now sit much closer to product strategy, modernization planning, and cost control than many executives expect.
Why App Performance Is Your Most Important Business Metric
App performance isn't just a technical health signal. It's often the clearest live read on whether your business is delivering what customers think they were promised.
A customer doesn't care whether the issue came from a database query, a third-party API, a frontend rendering problem, or an AI call that took too long. They care that the app felt unreliable. Once that happens, the damage shows up in abandoned sessions, lower confidence, and more pressure on support and operations.
That's why I advise leaders to treat performance as a business metric first and an engineering metric second. Fast software creates trust. Predictable software creates repeat usage. Observable software gives teams a way to protect both.
Performance now means end-to-end visibility
Modern performance monitoring tools don't stop at server health. The category grew up as APM evolved from basic server checks into full-stack observability, with modern guidance describing APM as covering metrics, logs, traces, infrastructure, and user experience so teams can follow a request end-to-end and diagnose problems faster, especially in distributed systems where isolated monitoring falls short, as outlined in Last9's overview of web application performance monitoring tools.
That shift is why old-school “everything is green” reporting often fails during moments that matter most. The system may be technically running, but the customer journey may still be degraded.
A practical way to think about it is simple. If your team can't connect a customer complaint to a trace, a log pattern, and the related service dependency, you don't yet have a performance monitoring strategy. You have a collection of signals.
Practical rule: If a business leader can't answer “what did the user experience, where did it break, and what did that cost us,” the monitoring stack is incomplete.
AI raises the stakes
AI modernization makes this more urgent, not less. Once product teams add model calls, prompt orchestration, retrieval pipelines, or agent-like workflows, latency and failure analysis become harder. A feature may cross several services before a response reaches the user, and each hop introduces another place where time, cost, and quality can drift.
That's one reason organizations are revisiting their observability foundations while also refining frontend and backend tuning. Wonderment's guide to improving application performance is useful here because it connects infrastructure thinking with user experience and modernization work rather than treating them as separate projects.
The business implication is direct. Performance monitoring tools help leaders protect revenue today and make smarter AI bets tomorrow. Without them, teams modernize blind.
The Six Pillars of Modern Performance Monitoring
Modern performance monitoring works through a set of complementary signals. Each one answers a different operational question. Together, they give engineering and business leaders a reliable way to separate a local defect from a systemic risk, and a short-lived slowdown from a problem that will hit revenue, support volume, or AI spend.
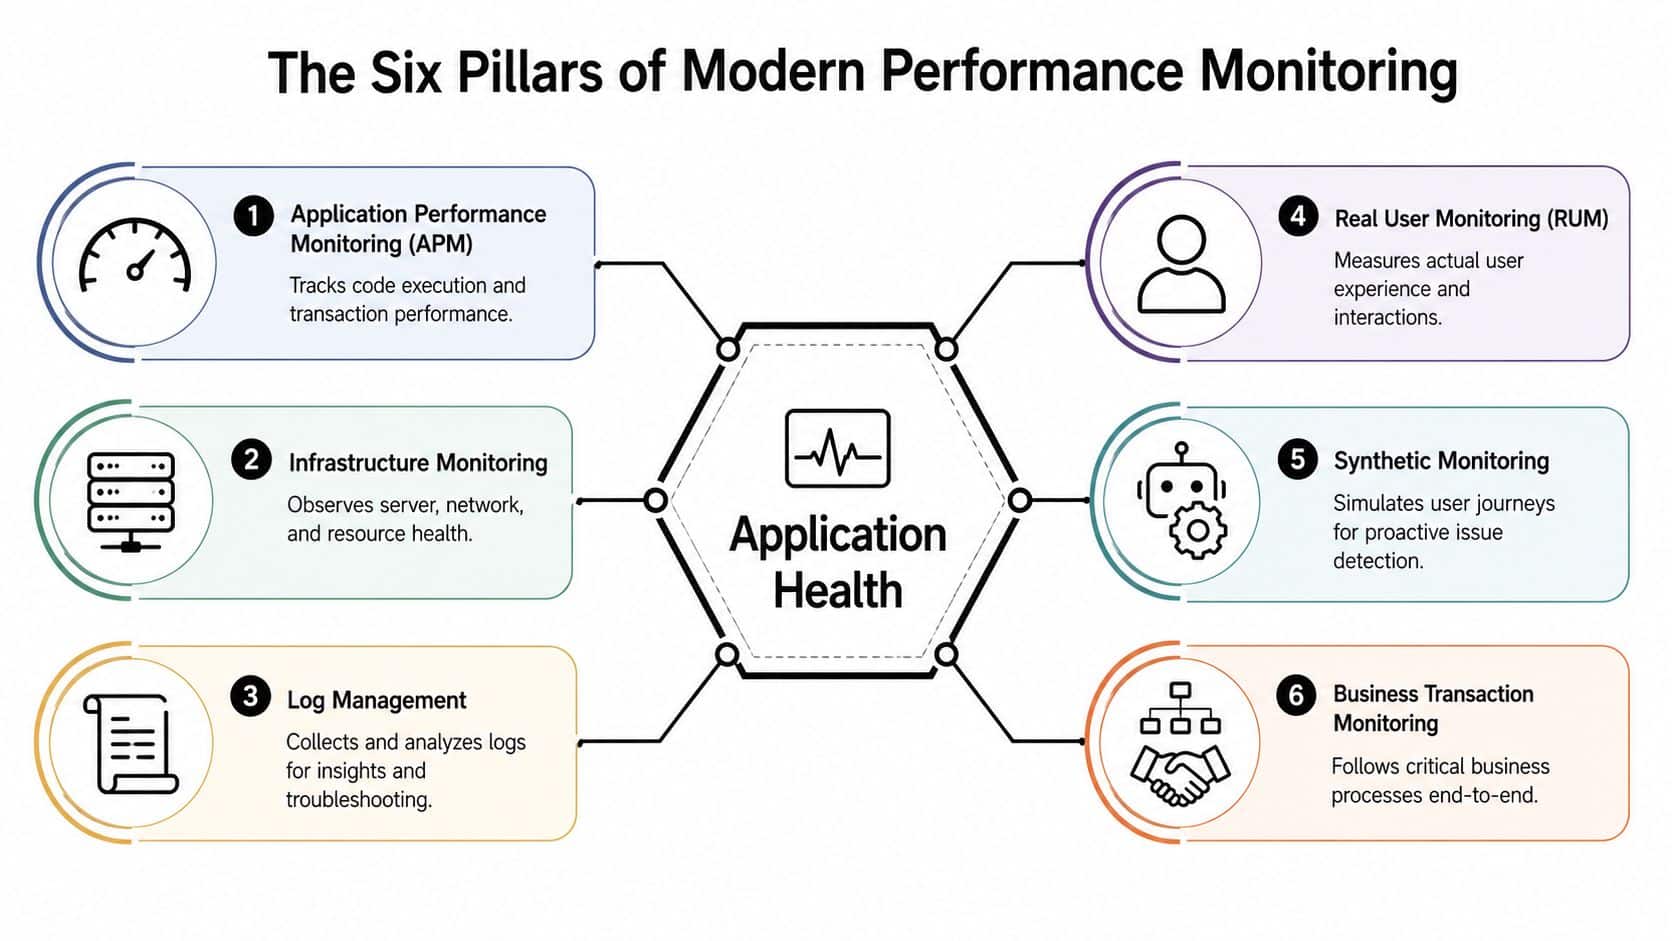
A mature stack usually includes six pillars: APM, infrastructure monitoring, logs, distributed tracing, real user monitoring, and business transaction monitoring. Some teams also treat synthetic monitoring as a separate pillar because it serves a distinct purpose in availability and release validation. The label matters less than the coverage. Gaps between these signals are where expensive incidents hide.
APM and infrastructure monitoring
Application Performance Monitoring, or APM, shows how code paths and transactions behave under real load. It helps teams find where time is spent, which requests slow down first, and where errors begin across services and dependencies.
Infrastructure monitoring answers a separate question. Is the runtime environment supporting the application well enough to keep performance stable? That includes compute saturation, memory pressure, container health, storage behavior, and network conditions that can degrade response times long before a customer files a ticket.
This distinction matters to leadership. If teams cannot quickly tell whether a slowdown came from code, capacity, or a platform dependency, incident response takes longer and modernization work gets riskier.
Logs and distributed tracing
Logs capture execution details that metrics often flatten away. They are useful for authentication failures, malformed inputs, intermittent integration issues, and policy decisions that only appear in application output.
Distributed tracing follows a request across services, queues, databases, and third-party APIs. That visibility becomes much more important once a product includes microservices, retrieval pipelines, model gateways, or agent workflows. One customer action can trigger several downstream calls, and each one adds latency, failure risk, and cost.
This is one reason observability platforms expanded beyond classic APM. They now combine metrics, logs, traces, infrastructure, and user experience data in one workflow, as described in Last9's explanation of how APM matured into full-stack observability.
Fast incident response usually comes from better correlation, not from collecting every possible signal.
RUM and synthetic monitoring
Real User Monitoring, or RUM, shows what customers experienced across devices, browsers, and network conditions. Backend services can look healthy while the customer still sees slow rendering, broken interactions, layout instability, or a failed payment step.
Synthetic monitoring tests important journeys on a schedule. It is useful for login, search, checkout, claims, and other paths where teams want early warning before a customer reports a failure. It also gives operations teams a controlled baseline for comparing live traffic against expected behavior.
A practical split looks like this:
| Pillar | Best question it answers |
|---|---|
| RUM | What are customers experiencing right now? |
| Synthetic monitoring | Would a critical journey succeed if someone tried it now? |
Metrics and business transaction monitoring
Metrics make trend detection and alerting workable at scale. Response times, throughput, error rates, and saturation signals help teams spot drift early and judge whether a change improved or worsened system behavior.
Business transaction monitoring connects telemetry to outcomes a leadership team already cares about. It tracks flows such as quote generation, subscription activation, order completion, claim submission, or support deflection. That is the layer that turns performance monitoring into a cost and modernization tool. It shows whether a slowdown affected conversion, whether an AI-assisted workflow increased latency enough to hurt completion rates, and whether a model-integrated feature is worth its infrastructure and inference cost.
Teams rarely fail because they lack dashboards. They fail because the stack cannot connect technical behavior to customer impact and financial impact fast enough. The six pillars close that gap.
Key Metrics That Actually Matter for Your Business
Most dashboards are too busy and not useful enough. They overflow with technical indicators, yet they still fail to answer the question a business leader is really asking: are customers having a good experience, and is the product still doing its job?
That's why the best performance monitoring tools don't just collect more signals. They help teams focus on the signals that connect software behavior to user outcomes.
User-facing performance comes first
If you only monitor backend health, you can miss the experience that determines whether a customer stays or leaves. Vendor roundups often emphasize tracing and logs, yet user-facing issues are often better exposed through real-user monitoring and error analysis. Raygun's coverage explicitly frames performance monitoring as discovering issues users encounter, not just infrastructure metrics, and highlights smart error grouping to reduce noise, as described in Raygun's review of performance monitoring tools.
That has a practical consequence. A clean infrastructure dashboard does not prove users are happy.
Focus first on metrics that describe what the customer felt:
- Load and interaction speed: How quickly the app becomes usable.
- Error visibility: Whether users are seeing crashes, broken states, or failed submissions.
- Journey completion: Whether people finish the actions that matter.
Application health should support user insight
Application metrics still matter. They just shouldn't sit alone at the center of decision-making.
Good teams use application health metrics to explain user outcomes, not replace them. If session frustration rises, health metrics help show whether the issue came from a deployment, a dependency, or a traffic pattern. If conversions slip after a release, health metrics help narrow the cause.
Here's the priority stack I usually recommend:
- Start with user experience metrics because they reflect lived product quality.
- Add application health metrics to explain what changed technically.
- Connect business KPIs so performance discussions don't stay trapped in engineering.
The dashboard should speak two languages
Executives and engineers need the same truth, shown at different levels.
| Audience | Most useful view |
|---|---|
| Executive team | User experience, incident impact, and business journey health |
| Product team | Feature-level friction, errors by flow, and release impact |
| Engineering team | Traces, logs, dependencies, and service performance |
Backend health can look stable while customer experience deteriorates on specific devices, browsers, or networks. That's why RUM isn't a nice-to-have. It's the reality check.
When teams skip that reality check, they end up optimizing systems that already look fine while the product experience keeps disappointing users. That's wasted effort.
For AI-enabled products, this matters even more. A fast service call can still produce a frustrating experience if the response arrives too late in the interaction, fails in edge cases, or introduces visible inconsistency. In those cases, user-facing telemetry is the only reliable way to see whether the feature is helping.
Choosing the Right Enterprise Monitoring Tools
Choosing a monitoring platform is closer to choosing infrastructure than buying software. Once teams instrument systems, train people, define alerts, build dashboards, and wire workflows around a platform, switching gets expensive fast.
So the right question isn't “which tool has the most features?” It's “which platform will still make sense as our architecture, delivery model, and AI footprint become more complex?”
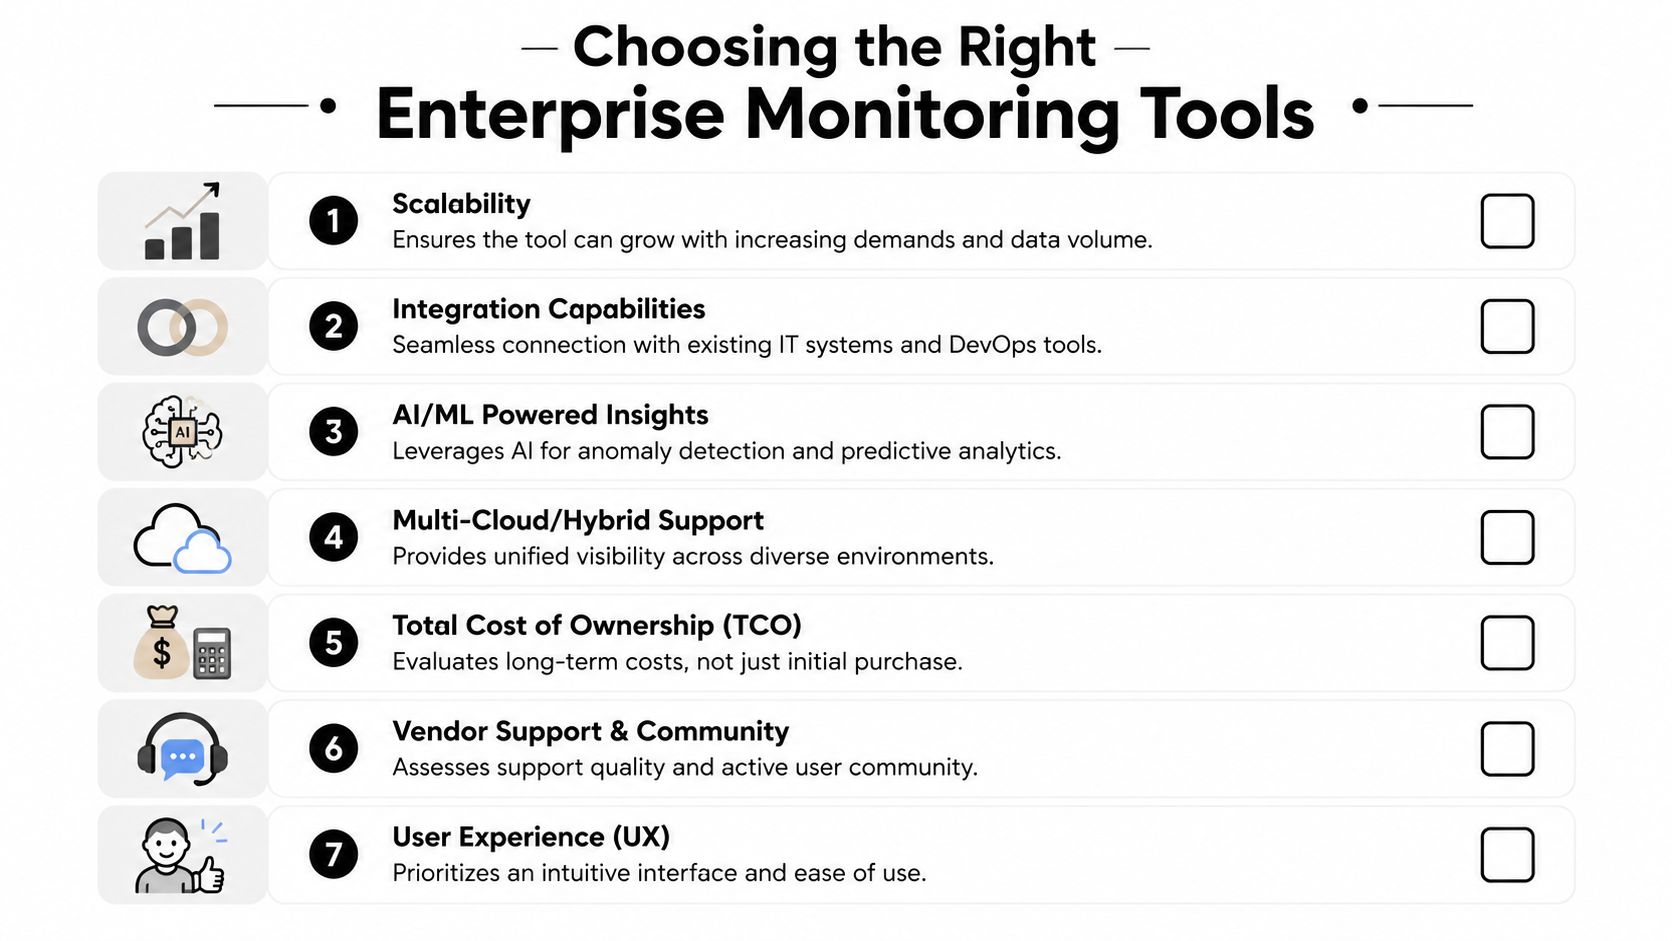
What strong evaluation criteria look like
Modern enterprise stacks increasingly depend on centralized, automated dashboards because teams manage far more data sources. That allows organizations to monitor business KPIs, application latency, infrastructure health, and end-user experience from one plane of glass, which is why unified platforms are repeatedly featured for real-time visualization and alerting in Synergita's roundup of KPI and performance tracking tools.
That “one plane of glass” idea is useful, but only if the platform is usable. I'd evaluate enterprise performance monitoring tools against these factors:
- Scalability: Can the tool handle growth in services, environments, and telemetry volume without becoming slow or difficult to govern?
- Integration depth: Does it work with your cloud stack, CI/CD workflows, data pipelines, and incident tooling?
- Open instrumentation support: If your team uses OpenTelemetry or plans to, the platform shouldn't fight that decision.
- Cross-team usability: Product, engineering, and operations teams should all be able to read the system from their own lens.
- Cost clarity: Pricing should be understandable enough that finance and engineering can manage it together.
Tool categories matter more than brand debates
The brand list is familiar. Teams often compare Datadog, New Relic, Dynatrace, AppDynamics, Elastic APM, Grafana, and Prometheus. That can be a useful starting point, but it often sends buyers into feature grid paralysis.
A better decision framework is to choose your operating model first.
| Operating model | Usually fits best |
|---|---|
| Unified commercial platform | Teams that want broad coverage and simpler consolidation |
| Open-source-centered stack | Teams with strong internal platform engineering capacity |
| Hybrid approach | Organizations balancing flexibility with executive reporting needs |
Prometheus and Grafana remain a common pairing in cloud-native environments for metrics collection and real-time dashboards, while platforms such as New Relic and Datadog are commonly positioned as unified observability options in enterprise roundups. The trade-off is familiar. Open stacks offer flexibility and control. Unified suites reduce tool sprawl and often simplify cross-team visibility.
What doesn't work
Three buying mistakes show up repeatedly.
- Buying for the demo: A polished incident replay isn't the same as day-to-day usability.
- Ignoring operating overhead: If the platform needs constant care, teams stop trusting it.
- Separating app monitoring from AI modernization: If AI is entering the product, your evaluation should include how well the stack helps trace, govern, and cost-manage those workflows.
The best enterprise choice is rarely the flashiest one. It's the one your team can sustain.
Best Practices for Implementation and Integration
A monitoring rollout usually succeeds or fails in the first few weeks. Not because of the product, but because of the setup decisions. Teams either create a useful operating rhythm, or they flood people with noise and inadvertently train everyone to ignore alerts.
A practical rollout starts narrow. Pick one critical application, one or two business journeys, and the minimum telemetry needed to make decisions. That gives the team a chance to prove value before instrumenting everything.
Roll out in phases
Large-bang monitoring projects tend to become inventory exercises. Teams wire up dashboards for dozens of services, but no one agrees on what matters, who owns which alert, or which views leadership should trust.
A phased implementation works better:
- Choose a critical workflow such as checkout, claims, onboarding, or search.
- Instrument the full path from user interaction through backend services and dependencies.
- Define ownership so alerts route to people who can act.
- Review signal quality before expanding coverage.
This is also where performance work should connect to delivery practice. A mature team ties monitoring to release confidence, regression prevention, and pipeline quality. Wonderment's guide to continuous performance testing is a good companion because it treats performance as part of software delivery rather than a separate support function.
Correlate signals or expect blind spots
Performance monitoring tools are most actionable when they correlate APM, logs, metrics, and RUM in one pipeline. That matters because bottlenecks often originate outside the application code itself, and cross-signal correlation reduces mean time to identify the failing layer, as explained in Hud's analysis of top application monitoring tools.
That single point changes implementation priorities. Don't ask only, “Did we collect the telemetry?” Ask, “Can we connect it during an incident?”
A noisy dashboard is annoying. A disconnected dashboard is dangerous, because it creates false confidence.
Design for different audiences
One common failure is showing everyone the same dashboard. Executives don't need trace waterfalls. Engineers don't need a summary tile that says user experience is “stable.”
Use role-based views instead:
- Executive dashboards: Business journey health, user impact, and major incident trends.
- Product dashboards: Feature friction, error clusters, and release comparison views.
- Engineering dashboards: Service dependencies, traces, log correlation, and environment-specific detail.
Alerting deserves the same discipline. The best alerts are specific, contextual, and tied to action. “CPU is high” rarely helps. “Checkout latency rose alongside payment API failures and mobile error reports” does.
Teams that get this right don't just monitor better. They collaborate better.
The New Frontier Monitoring AI and Controlling Costs
AI features break many old assumptions about application monitoring. A normal API call may be easy to benchmark. An AI workflow often isn't. One user action can trigger prompt assembly, retrieval, model calls, post-processing, moderation, logging, and persistence across multiple services.
That means a feature can feel slow, expensive, or unreliable even when standard service metrics look acceptable.
Standard monitoring usually misses the AI layer
For modern application performance monitoring, one of the most technically useful capabilities is distributed tracing plus one-second-granularity request capture. Coralogix's Instana coverage describes auto-discovering services with a single host agent and capturing 100% of requests at one-second granularity through AutoTrace, which improves root-cause analysis in microservices by preserving full request paths instead of sampling only a subset of transactions, as covered in Coralogix's guide to APM tools.
That detail matters for AI because sampling can hide the exact request path that produced a slow or costly outcome. If your team is tracing complex model calls, partial visibility is often not enough.
Still, even strong APM doesn't answer every AI question a product team has to manage. Leaders also need to know:
- Prompt behavior: Which versions produce stable results and which create regressions.
- Cost visibility: How usage accumulates across models, features, or customer segments.
- Operational logs: What happened across integrated AI providers and orchestration layers.
- Parameter control: How internal data access and runtime inputs are being managed.
AI modernization needs an administrative layer
A dedicated operational tool can complement broader performance monitoring tools. Wonderment Apps offers a prompt management system designed as an administrative layer for existing software, with a prompt vault with versioning, a parameter manager for internal database access, logging across integrated AIs, and a cost manager for cumulative spend visibility.
That isn't a replacement for observability platforms like Datadog, New Relic, Dynatrace, or Elastic APM. It serves a different purpose. It gives product and engineering teams a way to manage the AI-specific parts of modernization that standard infrastructure and APM tools don't fully expose.
What works in practice
Teams get the best results when they monitor AI in three connected layers:
| Layer | Main question |
|---|---|
| Application observability | Did the service path perform correctly? |
| User experience monitoring | Did the feature feel useful and responsive? |
| AI administration | Which prompt, parameter, and model usage pattern drove the result and cost? |
That combination is what lets a leadership team govern AI sensibly. Without it, they can see spend after the fact but not understand why it happened. Or they can see latency but not the prompt or parameter choices behind it.
For modernization programs, that's the true frontier. Not just getting AI into the app, but making it observable enough to trust.
Your Modernization Checklist Migrating to a New Monitoring Stack
Legacy monitoring stacks usually fail by fragmentation, not total absence. Teams have one tool for infrastructure, another for logs, another for synthetic checks, and a spreadsheet or tribal knowledge layer filling in the gaps. It works until the organization tries to scale releases, support more channels, or add AI services.
A cleaner migration starts with honesty. Inventory what you have, what teams use, and where decisions still depend on manual interpretation.
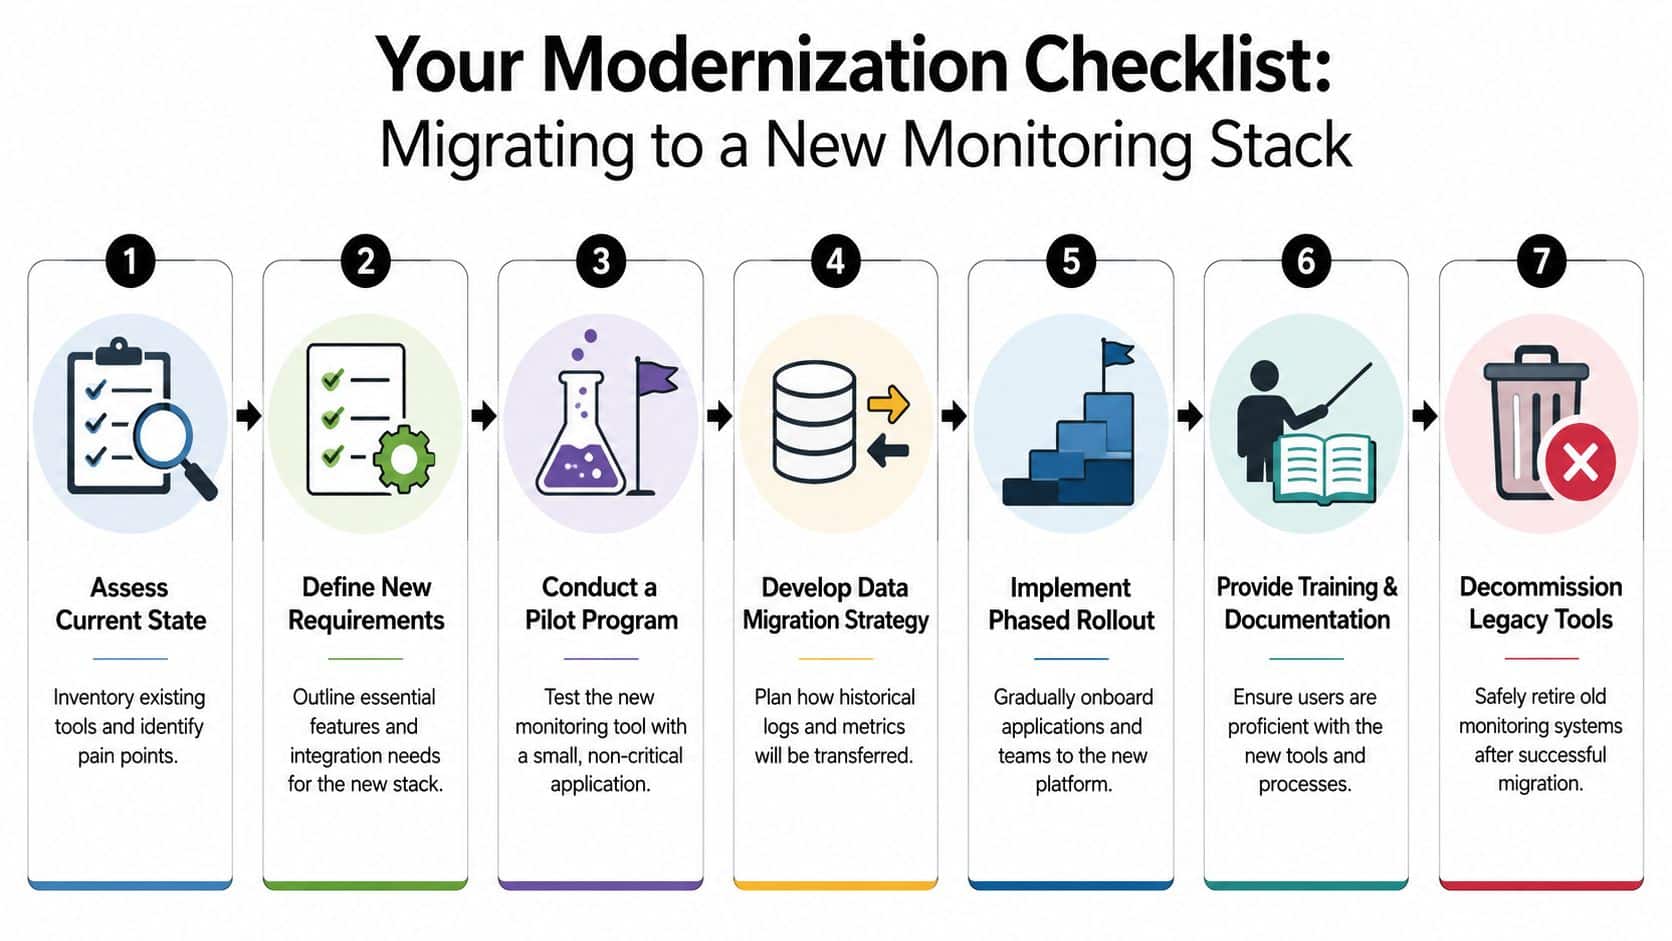
A practical migration path
A modernization checklist should be simple enough to execute and specific enough to prevent drift.
- Assess the current stack: Identify duplicate tools, missing visibility, weak ownership, and reporting gaps.
- Define future-state requirements: Include cloud, microservices, hybrid systems, and AI-related observability needs.
- Run a pilot: Test candidate platforms on a non-trivial application with real user flows and real incident scenarios.
- Plan data continuity: Decide what historical logs, alerts, and dashboards need to survive the transition.
- Train by role: Executives, product managers, developers, and operations teams need different usage patterns.
- Phase the rollout: Migrate high-value services first, then expand once alert quality and dashboards are trusted.
- Retire old tools deliberately: Don't keep legacy platforms alive forever “just in case.”
Keep the migration tied to modernization goals
The migration should support larger business goals, not become a tool project with no outcome. If the company is rebuilding customer journeys, adding AI features, reducing support load, or improving release confidence, the monitoring stack should make those initiatives easier to manage.
That's why I'd connect the monitoring migration plan to the broader application modernization roadmap from Wonderment Apps. Monitoring is one of the operational foundations that determines whether modernization stays maintainable after launch.
The best monitoring migration isn't the one that replaces the most tools. It's the one that gives the business a clearer operating picture with less friction.
A modern stack should help teams see user experience, service health, and AI behavior as part of the same system. If it does that, it stops being an IT utility and becomes a real advantage.
If your team is modernizing software, adding AI, or trying to connect product performance to business outcomes, Wonderment Apps can help you design the right monitoring and delivery approach. They work across web, mobile, UX, modernization, and AI integration, including administrative tooling for prompt management, logging, and cost visibility, so your stack stays scalable and understandable as it grows.