


Your product launch is going well until customers start reporting slow checkouts. CPU looks acceptable, so the team adds more application replicas. Latency barely moves. Then the database connection pool fills, payment requests queue up, and the system has more servers but less breathing room.
That failure pattern is why application auto scaling deserves more thought than a CPU threshold and a replica count. Good scaling connects a meaningful signal, such as checkout latency or queue depth, to a capacity decision, while accounting for startup time, dependencies, cost, and safe scale-in. It also belongs in the broader discipline of designing excellent applications, from mobile and desktop experiences to AI-enabled products that must remain responsive as adoption grows.
Why Application Auto Scaling Matters on Day One
A launch-day spike rarely arrives as a neat, gradual curve. A campaign sends shoppers to a product page, recommendation requests multiply, carts become active, and checkout traffic follows. Your frontend may still look healthy while a downstream service waits on database connections or a payment provider responds more slowly.
Application auto scaling is the policy that decides when to add or remove application capacity, based on an observed condition. It isn't a magic button and it isn't just "more servers." The policy must answer four practical questions:
- What signal matters? CPU can reveal compute pressure, while checkout latency reveals the experience customers feel.
- What capacity should change? The right response might be more API replicas, more queue consumers, or database capacity.
- How early must the system act? New containers, instances, caches, and connections need time before they serve useful traffic.
- What protects the system? Cooldowns, minimum capacity, maximum capacity, and dependency limits prevent a controller from making a bad situation worse.
Google's Borg offers a useful reminder of scale and concentration. A 2015 study described Borg managing hundreds of thousands of jobs across clusters containing tens of thousands of machines, while the top 1% of jobs consumed more than 99% of resources. That distribution shows why policies can't assume demand is evenly spread across applications. They need workload priorities, admission control, placement awareness, and real-time measurements. See the Google Borg research for the operational background.
Practical rule: Define success in user terms before choosing a scaling metric.
For a retail platform, that might mean keeping checkout responsive while product browsing absorbs bursts. A fintech team may prioritize authorization latency and queue age. A healthcare portal may protect appointment submission rather than scale every service equally. Teams evaluating architecture choices can also use Southern Tier Resources as a broader resource for technology and business support.
Autoscaling should complement cost discipline, not replace it. A useful next step is to connect scaling decisions with cloud cost optimization, because a policy that adds capacity successfully can still spend heavily without improving completed transactions or protected SLOs.
Vertical vs Horizontal Scaling in Plain English
Think of a building. Vertical scaling adds stronger machinery to one floor, perhaps a larger server, more memory, or a more capable database instance. Horizontal scaling adds more floors, each handling part of the work behind a load balancer or queue.
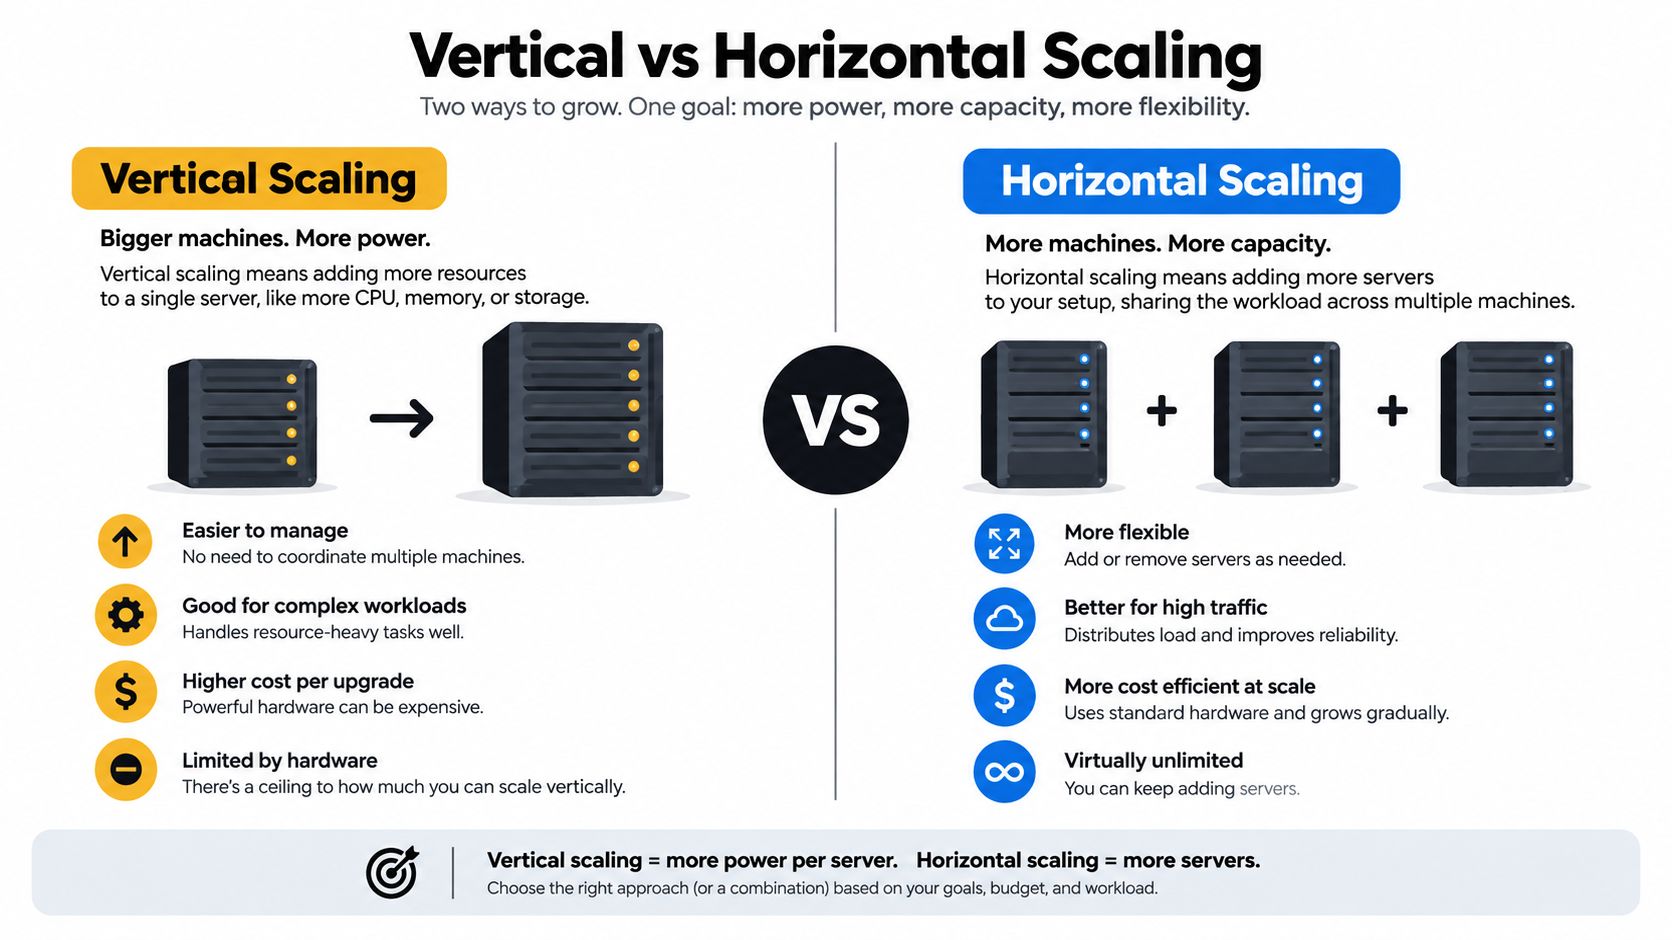
Vertical scaling is often the simplest first move. A legacy monolith may run on one larger machine with little or no code change. A stateful database may depend on local memory, storage performance, or a primary node that isn't easy to split. Redis primary workloads, older Postgres deployments, and tightly coupled applications can make “just add replicas” an unrealistic answer.
Horizontal scaling offers more elasticity. You can add web API instances, image processors, recommendation workers, or queue consumers as demand changes. The application must cooperate, though. Instances should start cleanly, share state through suitable external systems, handle duplicate work safely, and stop accepting new work gracefully before termination.
| Approach | Useful when | Main constraint |
|---|---|---|
| Vertical scaling | A stateful service or legacy application needs more capacity in one place | The machine has a ceiling, and resizing can require disruption |
| Horizontal scaling | Stateless APIs and workers can divide work across replicas | State, coordination, startup, and downstream limits must be designed |
| Hybrid scaling | Different tiers have different bottlenecks | Operators must coordinate several policies instead of tuning one knob |
A web API may scale horizontally while its database scales vertically. A queue consumer may scale out while the queue storage uses a separate capacity policy. The right choice depends on where the pressure originates, not on a universal preference for more replicas.
For a deeper decision framework on when to scale horizontally, compare workload state, failure behavior, and operational complexity. Containerization can make horizontal scaling easier, and the benefits of containerization include more consistent packaging and deployment. Neither removes the need to design state handling and dependency limits.
The Signals That Should Drive Your Scaling Decisions
CPU is easy to measure, which is why teams often use it first. It isn't always the signal that tells you whether customers are receiving a healthy service.
A controller can observe several kinds of pressure:
- Resource utilization: CPU may reveal compute saturation, while memory can expose leaks, large working sets, or cache pressure.
- Throughput and backlog: Requests per second, active sessions, queue depth, and queue age describe how much work is arriving and whether workers can keep up.
- User experience: Checkout latency, payment authorization time, error rate, and request latency show whether the application is meeting its promise.
- Capacity-specific signals: Database connections, cache hit behavior, search latency, and downstream rate-limit responses identify constraints outside the frontend tier.
CPU often behaves like a lagging indicator. A request can wait on a database or payment service while application CPU remains modest. Queue depth can act as an earlier warning for background work because it shows demand accumulating before workers reach full utilization.
Recent experimental research found that conventional autoscalers can struggle when they rely on low-level telemetry without jointly considering SLOs, cost, and application behavior. In those tests, incorporating latency and backlog signals produced up to 31% less SLO-violation time, 24% faster scaling response, and 18% lower infrastructure cost. The findings are reported in this research on application-aware autoscaling.
Combining signals without creating a tug of war
Multiple signals are useful, but careless combinations can make a controller oscillate. One metric says “scale out,” another says “scale in,” and the policy keeps changing direction before new capacity becomes ready.
Start with one primary signal tied to the user journey, then add guardrails:
- Choose the symptom: For checkout, use latency or failed authorization rather than CPU alone.
- Choose the workload pressure: For workers, use queue depth or queue age.
- Add a safety signal: Keep CPU, memory, error rate, or dependency saturation as a protection boundary.
- Set conservative scale-in behavior: Removing capacity should require sustained evidence, not one quiet measurement.
- Review the outcome: Measure completed work and SLO compliance, not replica count.
Your monitoring system should make these relationships visible. A practical performance monitoring tools review can help connect application telemetry with infrastructure behavior before you tune the policy.
How Kubernetes HPA, VPA, and Cloud Autoscalers Fit Together
A Kubernetes workload can look healthy at the Pod level and still fail the user journey. That is why autoscaling needs to be read as a control system, not just a replica counter.
The Horizontal Pod Autoscaler, or HPA, changes the desired number of Pods for a workload. It compares observed metrics with a target at regular intervals and makes a ratio-based recommendation. If the observed value is about twice the target, the recommendation is about twice the replica count, within the configured minimum and maximum. HPA can use average CPU and memory utilization, raw resource values, or custom metrics such as requests per second and I/O operations.
When no other metric target is specified, the Kubernetes HPA v2 API uses 80% average CPU utilization. Kubernetes also averages measurements across targeted Pods. Google Kubernetes Engine documents a stabilization behavior that uses the largest recommendation from the preceding five minutes to reduce rapid scale-down decisions and thrashing. These details appear in the Kubernetes HPA v2 API reference.
The layers and their blind spots
| Layer | What it scales | Signal | Blind spot |
|---|---|---|---|
| HPA | Application Pod replicas | Resource or custom application metrics | It doesn't create enough underlying nodes |
| VPA | Pod resource requests and limits | Observed CPU and memory needs | Recommendations or changes can disrupt running workloads |
| Cluster Autoscaler | Cluster nodes | Pending Pods and node utilization | It doesn't understand checkout quality by itself |
| Karpenter or similar node provisioners | Node capacity and placement | Pod requirements and infrastructure availability | It still needs application-level policies above it |
| Cloud autoscaler | Managed instances, tasks, or service capacity | A target-tracking metric | It may not see downstream dependencies |
VPA helps right-size resource requests, which can improve scheduling and make HPA behavior more meaningful. Letting VPA change production Pods while HPA is also reacting to load can create conflicting feedback, so teams often use VPA for recommendation and analysis before enabling disruptive updates.
The node layer matters just as much. HPA can ask for more Pods, but those Pods stay Pending if the cluster has nowhere to place them. Adding nodes also will not fix a fixed database connection pool or a downstream service that is already saturated.
AWS Application Auto Scaling expresses the same control-loop idea through target tracking. A team selects a CloudWatch metric and a target, then the service adjusts capacity toward that setpoint. A concrete example is tracking ALBRequestCountPerTarget with a target such as 500 requests per instance, so scale-out begins when each target is carrying more work than intended and scale-in happens when pressure stays low. Separate scale-out and scale-in cooldowns, along with instance warmup, keep newly created capacity from being counted before it can serve traffic. The AWS target-tracking documentation describes that behavior in detail.
Patterns That Make Autoscaling Actually Reliable
Reliable autoscaling combines reaction, prediction, and dependency awareness. Each addresses a different timing problem.
Reactive scaling observes demand and responds. It works well when capacity becomes ready quickly relative to the workload's tolerance. It fails when telemetry arrives after a burst has started and containers or nodes take longer to initialize than the available latency budget.
Predictive scaling moves the decision earlier. A forecast can pre-warm capacity before a scheduled campaign, product launch, or recurring peak. Research on Kubernetes autoscaling used Prophet and LSTM models to forecast HTTP request volume. When evaluated with NASA and FIFA World Cup traffic datasets, the approach achieved an accuracy advantage of up to 65% to 90% over single-model proactive alternatives. The forecasting study provides the experimental context.
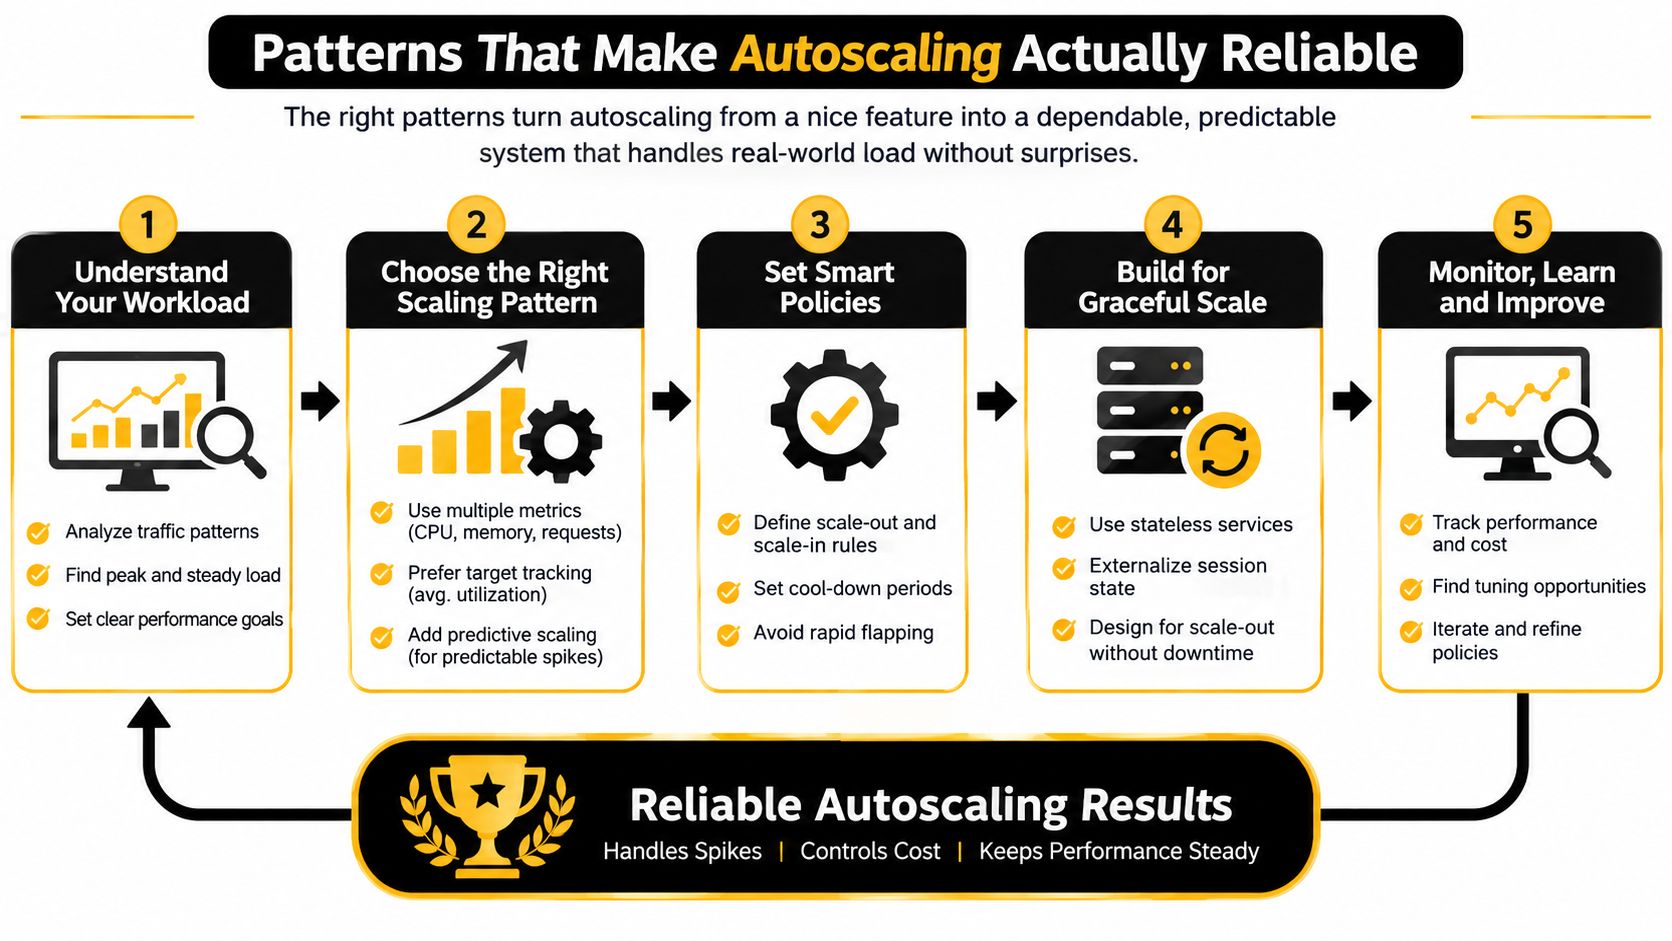
Forecasts aren't guarantees. A campaign may perform differently from historical traffic, a product may go viral unexpectedly, or a dependency may slow down without a corresponding request increase. Keep a latency- or queue-based feedback controller as the safety net.
Scale the system that owns the bottleneck
Dependency-aware scaling asks what must grow together:
- Checkout API and database: More API replicas may increase connection pressure. Review pool sizes, transaction time, and database capacity as one system.
- Queue consumers and queue storage: Adding workers helps only if consumers can remove work faster and the queue can absorb arrivals.
- Search tier and index layout: More search processes won't fix an overloaded shard or expensive query pattern.
- Recommendation service and model infrastructure: More request handlers may expose model-serving or feature-store limits.
- Stateful services: Cache warm-up, replication, migration, and locality can make scale-out temporarily slower.
A sound policy uses forecasts to cover known lead time, feedback to correct errors, and dependency limits to stop one tier from overwhelming another. Test the complete path with replayed production traces, including warm-up, queue behavior, latency, excess capacity, and replica churn.
When More Replicas Make Things Worse
More replicas can raise throughput, but they can also expose the bottleneck you have not scaled yet.
A service that looks healthy on the surface can still be headed in the wrong direction. An API may add replicas while each one opens connections to a database with a fixed connection budget. The app appears to have more capacity, yet the database spends its time managing connection pressure, and user-facing latency climbs even as application CPU drops. The same pattern shows up when checkout replicas push against a payment gateway rate limit, or when search workers create more demand than a shard can absorb.
State makes this harder to read. New instances may need to warm caches, establish database connections, register with a load balancer, or claim partition ownership. Stateful services may also need data migration or shard rebalancing. During that window, the system has more nominal capacity, but not necessarily more useful capacity.
Read the outcome, not the replica count
The cleanest signal is the user result. If replicas are rising but the bottleneck is still in charge, the scaling event is not helping.
Watch for these warning signs during a scale event:
- Latency stays flat or climbs: The added tier is not easing the user-facing bottleneck.
- Dependency errors increase: Database, cache, payment, or search failures point downstream.
- Queue age keeps growing: Consumers may be limited by processing time, storage, or a dependency.
- New replicas remain cold: Startup work is consuming the capacity you expected to add.
- Scale events repeat: Short measurement windows or cooldowns may be causing churn.
A survey of 60 autoscaling studies found that cost, SLO, and energy objectives are still rarely optimized together under standardized benchmarks. The same autoscaling survey also points to coordination across services, actuation delays, and hybrid horizontal-vertical scaling as open challenges.
Scale the tier that owns the symptom, not the tier that is easiest to duplicate.
If frontend replicas rise while checkout latency and payment failures worsen, stop reaching for more frontend capacity first. Trace the request path, identify the constrained dependency, and decide whether the right move is capacity, admission control, caching, batching, or a change in the transaction design.
Testing Autoscaling Before It Matters
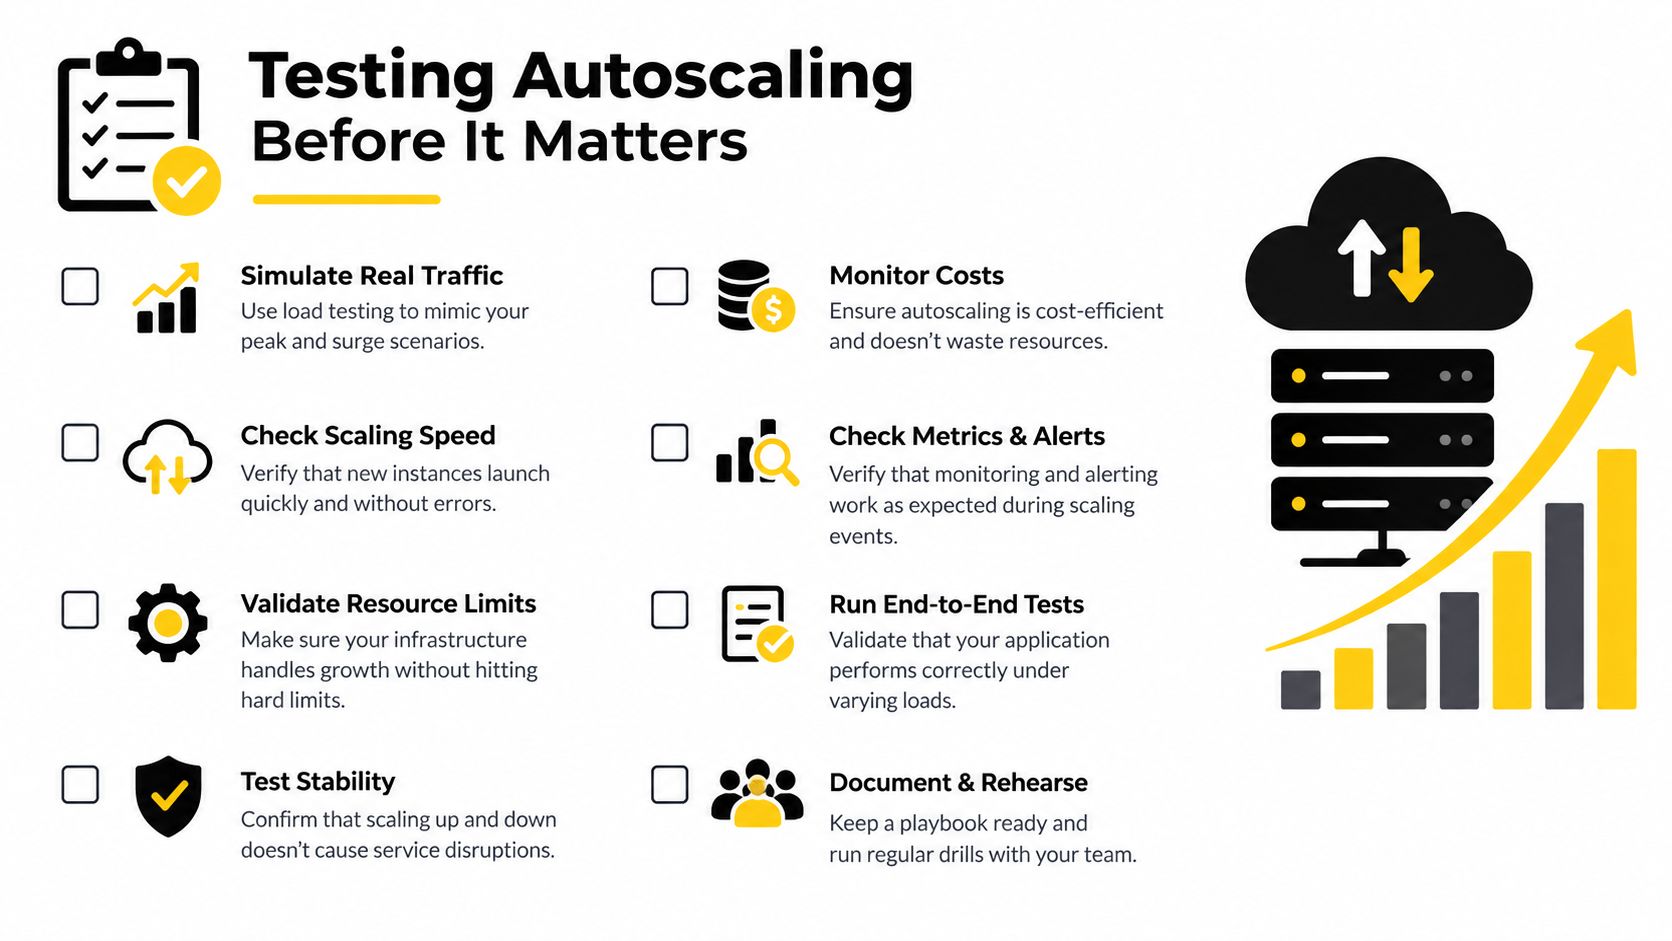
A scaling policy should fail safely in a test environment before customers discover its limits. Treat the exercise as a controlled experiment, not a button-click demonstration.
Start with a baseline at ordinary demand. Record request-level latency, errors, throughput, queue behavior, dependency saturation, and current capacity. Then introduce a burst ramp that resembles a launch, campaign, or sudden media event. A gradual ramp and an abrupt jump expose different weaknesses, so use both when the environment and budget allow.
A practical test sequence
- Exercise scale-out: Confirm that the selected signal changes before the user-facing SLO fails. Measure the time from threshold crossing to useful capacity.
- Check warm-up: Verify that new Pods or instances pass real readiness checks, load required caches, establish connections, and receive traffic before the controller treats them as available.
- Hold the load: Keep demand steady long enough to observe whether the policy settles or keeps adding replicas.
- Test scale-in: Reduce demand and watch whether latency, errors, queue age, or active sessions degrade as capacity leaves.
- Stress dependencies: Increase database work, cache misses, downstream calls, and queue pressure. Adding application replicas should not shift failure into another tier.
- Test rollback: Define when to disable the policy and return to a known fixed capacity, especially if churn or dependency errors exceed your safety boundary.
Instrument each run with request-level SLO violations, scale-out lead time, forecast error, excess capacity, replica churn, and cost per successfully served request. These measures turn “autoscaling worked” into a claim you can test. A refined Cluster Autoscaler configuration improved autoscaling accuracy in a vendor-neutral Kubernetes study but did not produce significant cost savings, showing why both SLO protection and total cost belong in the scorecard. The Cluster Autoscaler evaluation explains that distinction.
For broader methods, teams can browse performance engineering techniques that connect load generation, profiling, bottleneck analysis, and production-oriented validation.
The most useful test result may be a failure. It can reveal that CPU reacts too late, capacity is counted before warm-up completes, a database cannot accept the added connections, or a downstream provider imposes a limit your application never modeled.
Putting It Together and Modernizing Your Stack
Application auto scaling works best as a business control loop. The objective is not just to add replicas when CPU rises. It is to protect user journeys while controlling the capacity and dependency costs required to serve them.
- Observe a meaningful signal, such as checkout latency, queue depth, or successfully served requests.
- Analyze whether that signal reflects a sustained bottleneck, a dependency limit, or temporary noise.
- Plan a capacity change that accounts for startup time, database connections, and downstream limits.
- Execute the change through HPA, a cloud autoscaler, a queue policy, or a stateful-system procedure.
- Verify that the user journey improved, using SLO results, excess capacity, churn, and cost per successfully served request.
Each step maps to a practical control. HPA can apply the decision to application replicas. Queue depth can reveal work waiting for capacity before request latency becomes visible. A database connection limit can set an upper boundary on frontend scale. Cost per successfully served request can show whether added capacity produced useful service rather than idle infrastructure.
Timing must match the problem. A reactive controller handles sudden pressure, while a forecast or schedule starts capacity before a predictable demand change arrives. Startup and warm-up time create lead time that the policy must anticipate. Cooldowns reduce oscillation, and dependency-aware limits prevent a healthy frontend from overwhelming a database, cache, payment gateway, or search tier.
Cost belongs beside reliability. A policy may reduce SLO violations while adding capacity that serves little useful work. It may also reduce infrastructure spend while customers encounter slow checkout or failed payments. Review protected user journeys, excess capacity, and cost per successfully served request together.

The same control-loop thinking applies when modernizing an existing application with AI. An assistant, recommendation feature, document workflow, or anomaly detector adds new signals and policies. Teams need visibility into active prompts, accessible internal data, changing model behavior, usage, reliability, and cost.
Wonderment Apps' prompt management system is one administrative option for teams adding AI to an existing application. It includes a versioned prompt vault for managing prompts as controlled assets, a parameter manager for governing internal database access, a logging system across integrated AI services, and a cost manager showing cumulative spend. These controls give AI operations a view similar to an infrastructure scaling dashboard, connecting behavior, data access, reliability, and cost.
The AWS target-tracking model is another implementation of this feedback loop, as described in the AWS target-tracking overview.
The durable approach is consistent: choose user-facing signals, make the policy explicit, account for lead time, protect dependencies, observe outcomes, and tune against real service results. Whether scaling checkout capacity or adding AI to a legacy product, responsible modernization gives the team enough control to understand what changed and why.
If your application needs more than a quick autoscaling patch, Wonderment Apps can help modernize web and mobile software, integrate AI features, and build observability and capacity controls for those features. The platform and prompt management demo show how versioned prompts, governed data access, AI logging, and cumulative cost visibility can fit into an existing product.