

Better algorithms don't automatically produce better retention. A churn prediction model can rank customers with impressive accuracy and still fail commercially if nobody knows what to do with the score, when to act, or how to measure whether the intervention worked. In production, the model is only one component of a larger system that connects customer data, decision rules, human teams, messaging, product changes, and financial outcomes.
That operational layer also determines whether AI integration remains maintainable as an application grows. A prompt management system such as the administrative tooling offered by Wonderment Apps can help development teams manage prompt versions, parameters, logs, and AI-related costs when retention workflows use generative AI alongside predictive models. The same discipline applies to churn scores: version the logic, record each decision, and make the resulting action auditable.
Why Most Churn Prediction Models Fail to Improve Retention
A churn model can be accurate and still leave retention unchanged. The failure usually sits outside the algorithm: no owner receives the score, no intervention is approved, or no experiment measures whether the action prevented cancellation.
A large telecom study using several terabytes of data reported 89.4% prediction accuracy, while the natural churn rate during its evaluation period was roughly 24%. The tested algorithms clustered between 88.5% and 89.5% accuracy, showing that different models can produce nearly identical headline results. Accuracy alone does not show whether the team contacted the right customer before cancellation, offered help the customer needed, or spent more on retention than the account was worth. The study details and figures are summarized here.
The gap between a score and a saved customer
A score becomes operational only after it enters a defined workflow. That workflow needs an accountable owner, a reason code, an intervention window, an approved action, and a measurement plan. It also needs safeguards for contact frequency, eligibility, and customer consent where applicable.
Consider a SaaS account with declining usage. A weekly batch may flag it on Monday, although a broken integration caused the decline on Friday and the customer has already decided to leave. The customer success manager might receive a high-risk score without knowing whether to provide technical support, restore onboarding, clarify pricing, or involve an executive sponsor.
Practical rule: A churn score without a next action is a report, not a retention program.
Monitoring matters after launch. Teams should check score coverage, data freshness, calibration, intervention acceptance, and outcomes by segment. A model can retain its validation accuracy while feature definitions change, a new billing flow alters behavior, or the service team stops acting on alerts. Review those signals with retention results, not in isolation.
External events create another blind spot. Budget cuts, mergers, and the departure of an internal champion can drive churn while product behavior still looks healthy. Behavioral features may reveal the consequences too late to change the outcome. Combine risk scoring with account context, support intelligence, renewal information, and informed human judgment.
Teams designing the wider program can consult reduce customer churn strategies for intervention ideas, then adapt them to their margins and customer journeys. Wonderment Apps also covers implementation considerations in its guide to how to reduce customer churn.
The useful question is “Can we convert predictions into profitable, compliant action at the right time?” That framing keeps model development connected to intervention design, monitoring, and measurable retention outcomes.
Understanding Churn Prediction Model Fundamentals
A churn prediction model estimates the probability that a customer will stop using a product or cancel within a defined future window. It learns from historical examples, where the business knows what happened after a prior observation point, and applies those learned patterns to current customers.
The basic idea resembles weather forecasting. A forecast doesn't claim that rain is a permanent characteristic of a city. It combines current conditions and historical patterns to estimate what may happen during a specific period. Churn models work similarly. Login gaps, declining feature use, payment failures, support activity, plan changes, and engagement decay become signals that influence a customer's estimated risk.
From probability models to machine learning
The field has a long history. A 2025 survey traces its roots to Customer Lifetime Value prediction models from 1988, traditional machine learning work around 2000, graph modelling in telecom around 2008, and statistical probability models for customer bases in 2009. It also identifies K-nearest neighbours, Naive Bayes, logistic regression, support vector machines, bagging, and boosting as algorithm families that became standard in churn prediction. The survey provides this historical overview.
The model usually receives a feature table. One row represents a customer at a specific point in time, and each column describes information available then. The target label records whether the customer churned during the chosen horizon. This time boundary matters. If the training data includes a cancellation request that happened after the observation date, the model has seen the future and the reported performance is misleading.
Binary risk versus time-to-event prediction
Binary classification answers, “Will this customer churn within the selected window?” The output can support a retention queue, an in-app message, or an automated billing reminder.
Survival analysis asks a different question, “When is churn most likely to happen?” That distinction matters for subscriptions, where the timing of outreach may be more valuable than a simple yes or no. A customer with moderate risk in the near term may need a different workflow from a customer with similar risk spread across a longer period.
The most important design decision is the prediction target. Define the event, observation point, horizon, and action before selecting an algorithm. Teams exploring broader applications can also review machine learning for businesses for context on integrating predictive systems into operational software.
Choosing the Right Model Family for Your Use Case
Model selection should follow the decision the business needs to make. A complex model isn't automatically better if customer success teams can't understand its recommendations, the data pipeline can't support it, or the intervention doesn't change behavior.
Gradient-boosted trees
XGBoost and LightGBM are strong defaults for structured customer data. They model nonlinear relationships and interactions without requiring every relationship to be specified manually. Benchmark studies consistently report that gradient-boosted tree methods outperform linear baselines and many standard classifiers on imbalanced churn datasets. One comparative study reported XGBoost at ROC-AUC 0.93 and PR-AUC 0.93, with recall 0.98 and F1 0.91 on 18,491 SME customers. The comparative study is available through Applied Information Systems.
Those results don't transfer automatically. A survey covering 16 datasets found that sampling strategy and dataset characteristics materially changed model rankings. A strong model on one telecom or SaaS dataset may need new thresholds, resampling, and calibration elsewhere.
Traditional classifiers
Logistic regression remains useful when transparency, stability, and governance matter more than marginal ranking performance. Its coefficients offer a relatively direct explanation of how features relate to the outcome, although correlated variables and nonlinear effects can complicate interpretation.
Random forests provide a middle ground. They handle nonlinear patterns and can be easier to operate than a heavily tuned boosting pipeline, but they may not rank risk as efficiently on every structured dataset. In regulated environments, a slightly simpler model can win because compliance, review, and customer-facing explanation are part of the total cost.
Sequential and survival approaches
LSTMs and transformers can represent event sequences, such as repeated usage changes, support interactions, or billing incidents. They may be appropriate when order and timing carry information that aggregated features lose. Their costs include greater data requirements, harder debugging, more demanding infrastructure, and a heavier monitoring burden.
Survival models fit businesses that need intervention timing. They can support renewal planning, contract outreach, and capacity decisions by estimating how risk changes over time rather than collapsing the future into one label.
| Model Family | Best For | Typical AUC | Interpretability | Maintenance |
|---|---|---|---|---|
| Gradient boosting | Structured data and ranking customers for intervention | Dataset-dependent | Moderate with SHAP | Moderate |
| Logistic regression | Transparent decisions and regulated workflows | Dataset-dependent | High relative to complex models | Low |
| Random forests | Nonlinear patterns with straightforward operations | Dataset-dependent | Moderate | Moderate |
| Survival models | Estimating when churn may occur | Dataset-dependent | Moderate | Moderate |
| Sequential models | Rich event histories and timing-sensitive behavior | Dataset-dependent | Lower unless carefully explained | High |
A subscription study illustrates why teams should inspect more than one metric. LightGBM reached a test ROC-AUC of 0.866, test PR-AUC of 0.705, and test log loss of 0.211, while logistic regression reached a test ROC-AUC of 0.866 on the same task. The reported comparison is documented here. Equal ROC-AUC doesn't mean equal operating value, especially when precision-recall behavior and calibration differ.
Feature Engineering Patterns That Work
Feature engineering often delivers more practical value than searching for another algorithm. The strongest inputs describe change, recency, and customer context, rather than accumulated activity alone. A high-risk score is useful only when its drivers point to an intervention the business can deliver.
Set a clean observation date first. For each customer, calculate features from information available at that time, then align them with the product's actual usage pattern.
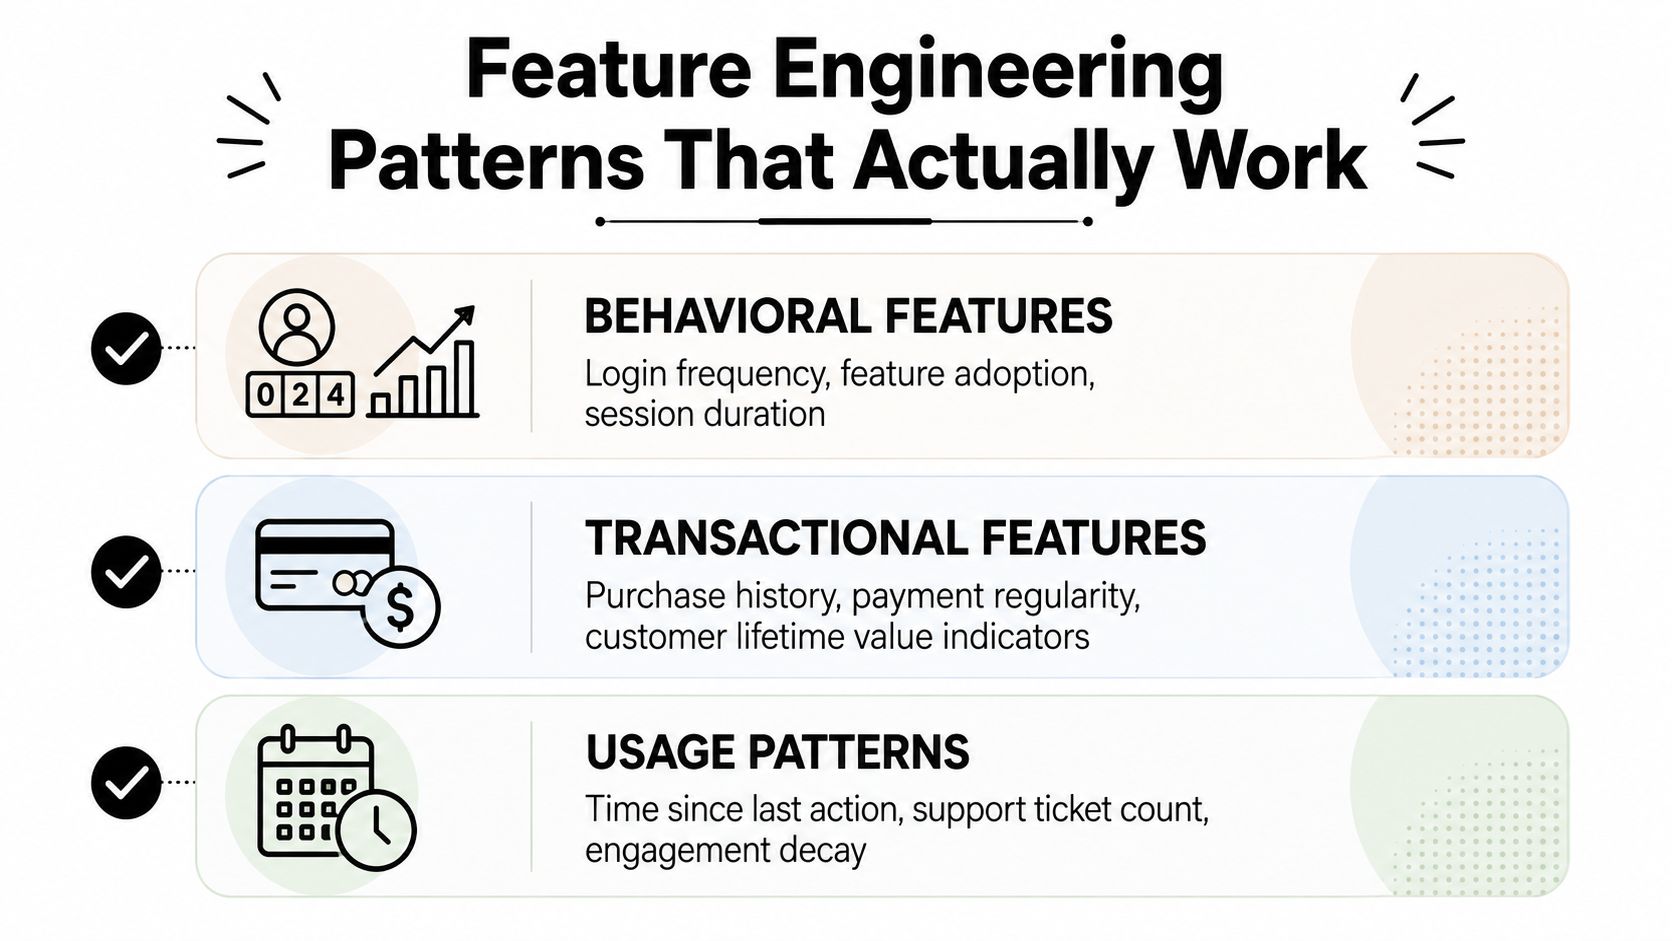
- Behavioral signals: Login frequency, feature adoption, session duration, completed workflows, and repeated failed actions indicate whether the customer still receives value.
- Transactional context: Payment history, failed charges, plan changes, purchase recency, and customer lifetime value indicators help distinguish product disengagement from billing risk.
- Engagement decay: Time since the last meaningful action, support ticket count, declining usage, and reduced participation can reveal deterioration more clearly than total activity.
Use time as a feature
A single usage count hides direction. Five sessions this week may look healthy, yet represent a steep decline from earlier activity. Rolling windows, trend calculations, recency measures, and seasonality adjustments make the model responsive to movement.
Use separate windows for recent behavior and longer context. A short window can expose an onboarding failure or sudden payment issue. A longer window can show whether the account has established durable adoption. More history is not automatically better. One long-horizon study found that predictive gains from adding history diminish after about five years, so high-quality recent behavior may be more useful than an ever-longer event archive.
Treat imbalance as a design problem
Churn is often the minority class, allowing raw accuracy to reward a model that predicts most customers will stay. SMOTE and related resampling methods can improve minority-class detection. One benchmark reported performance improving from 61% to 79% after SMOTE, indicating less target-label bias. The benchmark and imbalance discussion are available here.
Apply resampling only within training. Resampling before the train-test split can move synthetic information across evaluation boundaries and inflate results. Review balanced accuracy, recall, precision, calibration, and top-k lift together. Then test whether the selected customers can enter an intervention workflow with defined ownership, timing, and treatment.
Remove features that add complexity without improving the intervention list. Compare feature sets through time-based validation, inspect stability across customer segments, and confirm that operations can act on each signal. A feature that improves ranking but has no associated action may be less valuable than a slightly weaker feature that exposes a fixable product problem. Track that relationship after launch, because feature drift or workflow changes can turn a useful signal into noise.
Evaluation Metrics That Align with Business Outcomes
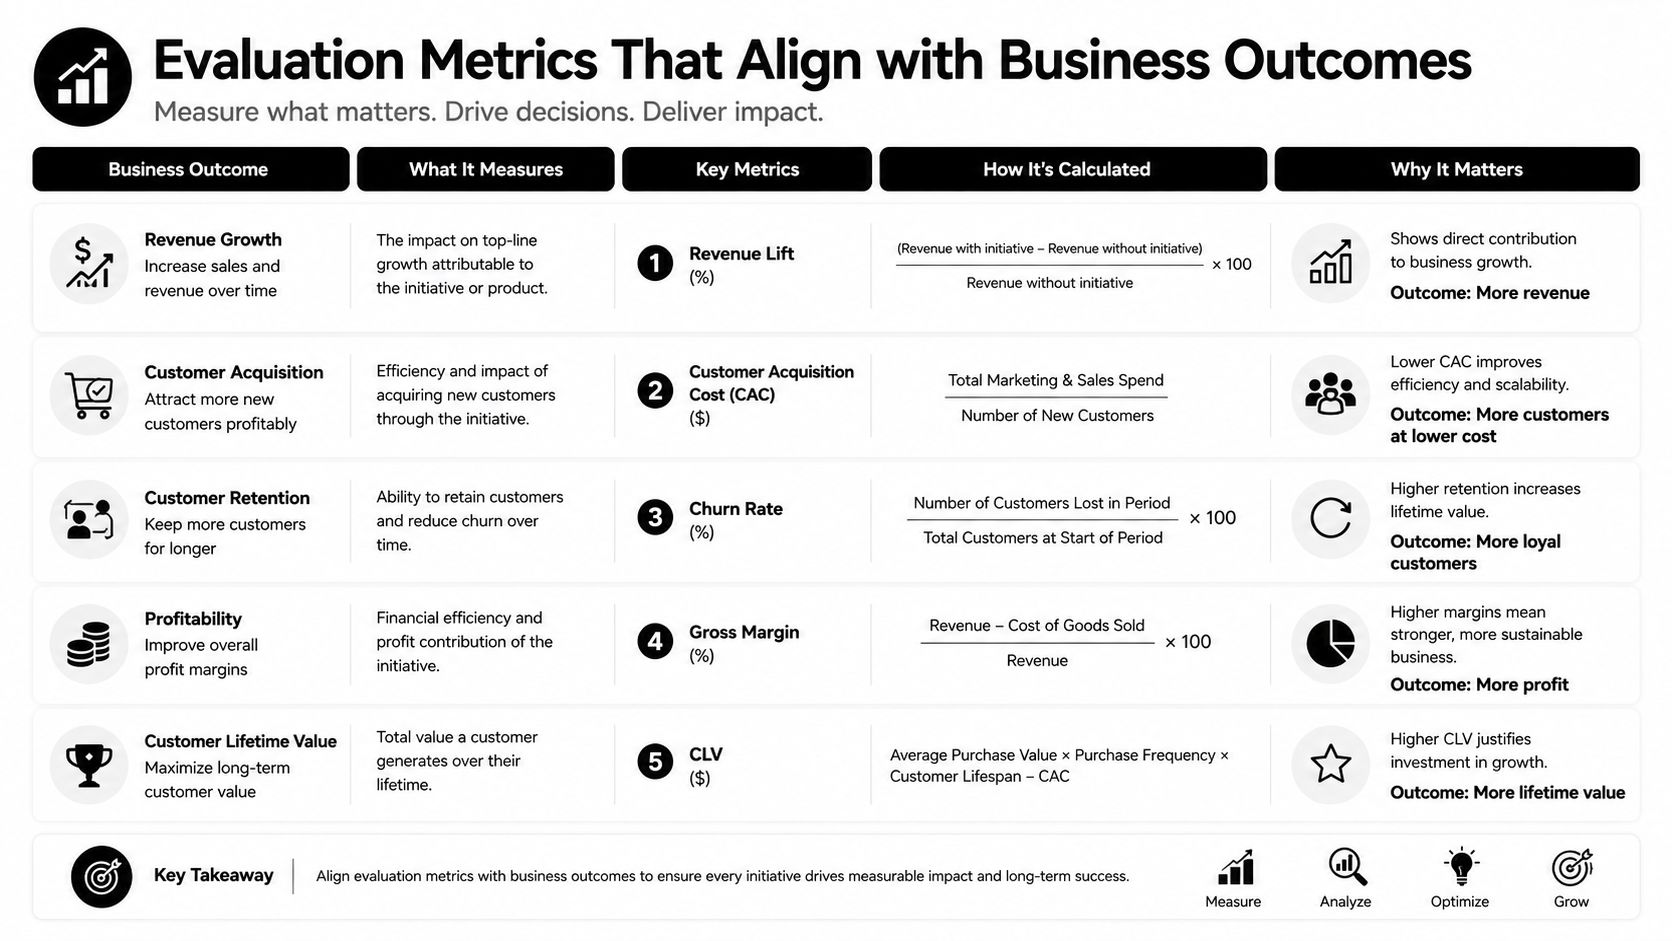
Accuracy answers a narrow question, and churn programs rarely operate under narrow conditions. If only a limited share of customers can receive outreach, the practical concern is whether the model concentrates likely churners near the top of the list.
ROC-AUC measures ranking across classification thresholds, but it can look healthy when the positive class is small. PR-AUC focuses more directly on precision and recall for the churn class. Top-decile lift adds an operational lens by asking how much more churn appears in the highest-risk group than in a randomly selected group.
Connect thresholds to economics
A threshold is a business decision, not merely a machine learning setting. Lowering it may capture more potential churners, but it also sends more false positives to customer success teams. Raising it can preserve intervention capacity while missing customers who would have benefited from help.
Build the decision around the intervention:
- Estimate the value of a retained customer using the business's own lifetime value method.
- Record the full cost of the action, including discounts, incentives, human time, and service capacity.
- Rank customers by predicted risk and value, not risk alone.
- Compare saved-customer outcomes with a control group that receives ordinary service.
Calibration matters because a probability should mean something. If a group receives a predicted risk of 0.7, the observed churn rate for comparable groups should be reasonably close to that estimate. Poor calibration can cause a team to overfund low-risk outreach or under-resource urgent accounts.
A useful dashboard should place model metrics beside operational measures. Guidance on operational dashboard KPIs and design can help teams decide how to present queue volume, response time, intervention status, and business outcomes without burying the decision-maker in charts. For a deeper review of evaluation choices, see AI model evaluation.
The final test is causal. Did the intervention change behavior or merely identify customers who were already likely to stay? Randomized holdouts, clear treatment definitions, and outcome tracking protect the program from flattering but meaningless reporting. A model can improve AUC while the retention program produces no incremental value.
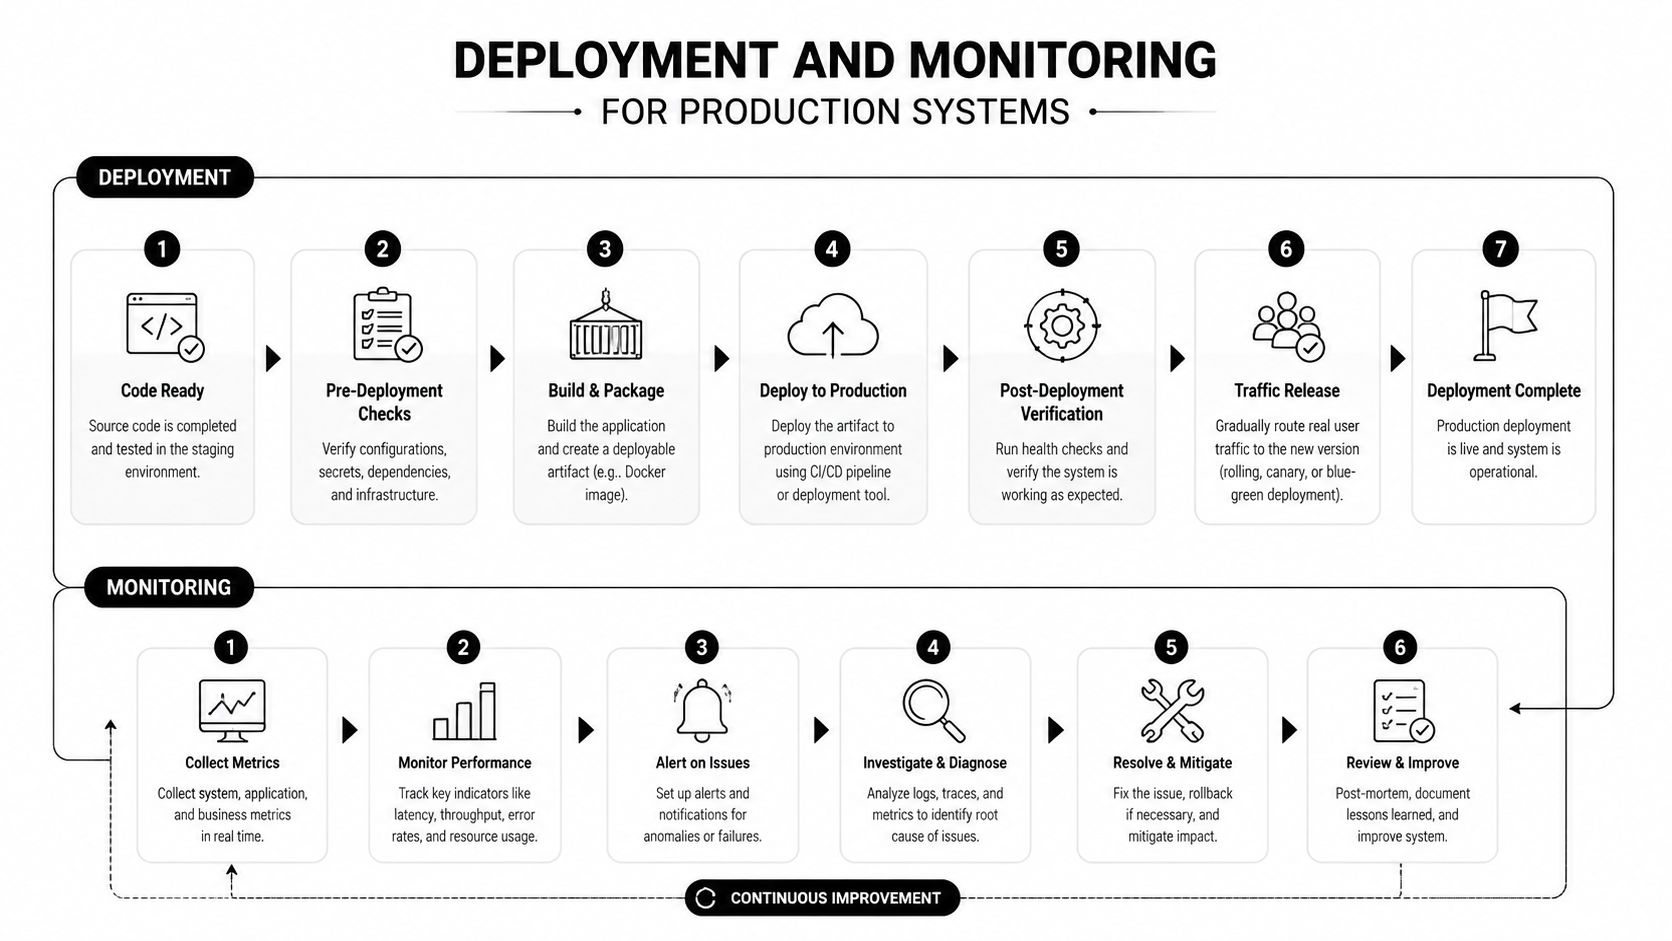
Deployment and Monitoring for Production Systems
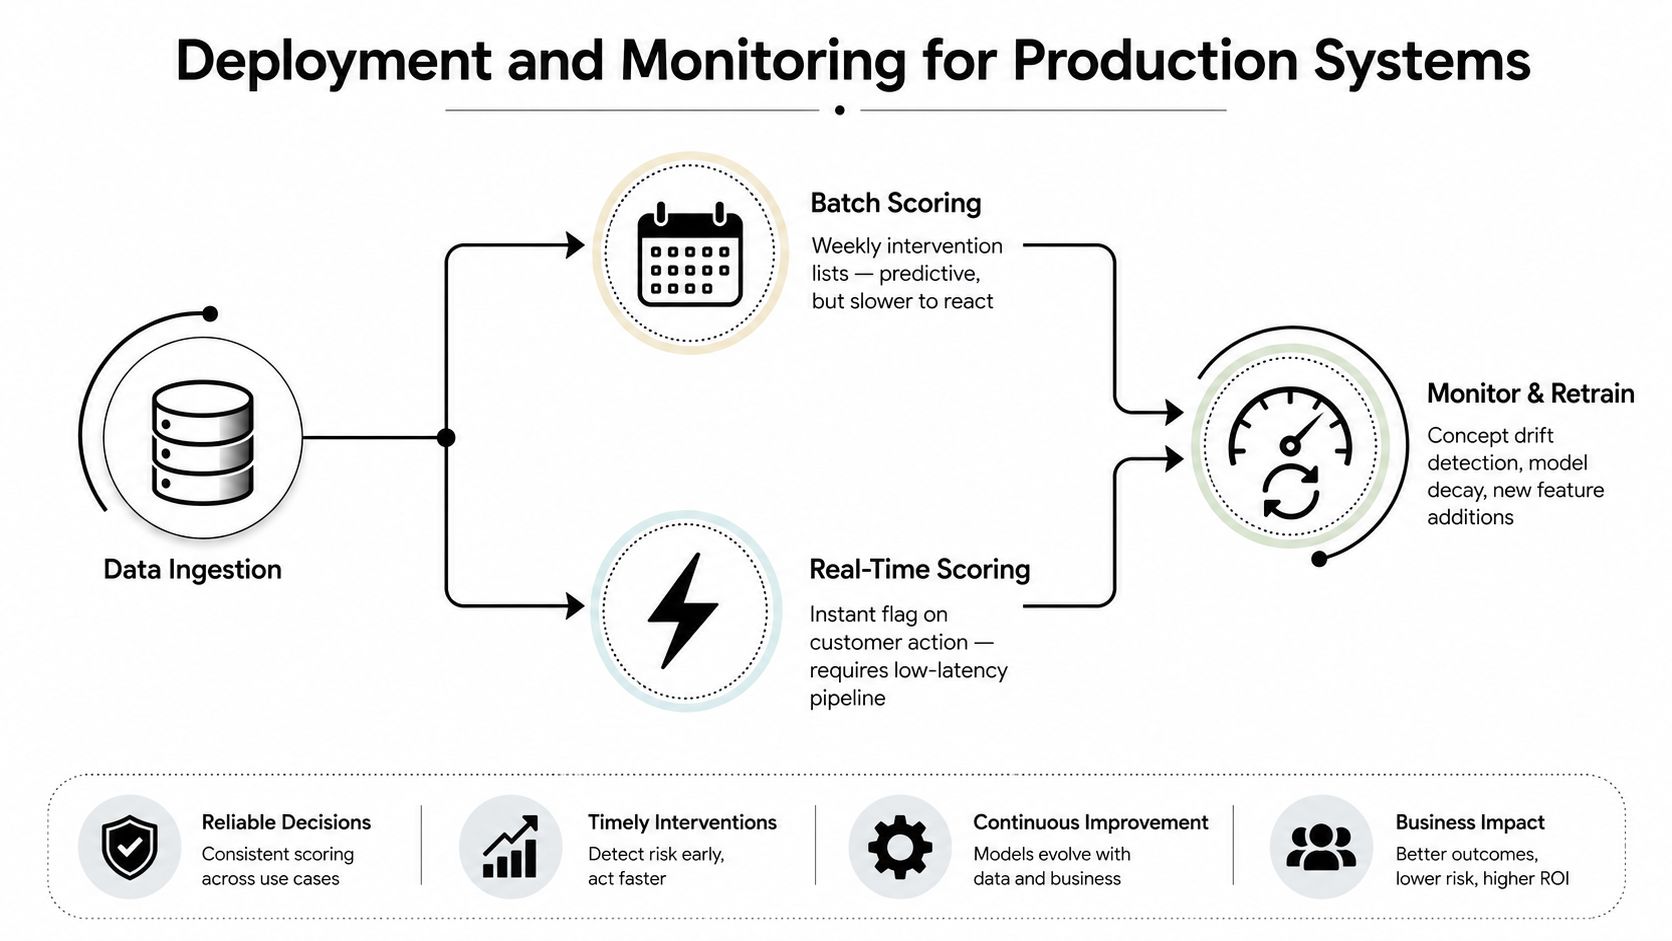
Production churn systems need less glamour and more operational discipline. A model that runs reliably with understandable outputs will usually create more value than a complex model that arrives late, fails without warning, or gives customer teams no usable explanation.
Batch scoring works well for planned workflows. A weekly list can support account reviews, renewal preparation, and campaign planning. Real-time scoring fits moments where timing matters, such as a failed payment, a sudden drop in core feature use, or a customer encountering repeated friction inside a mobile app. The choice depends on response windows, data freshness, integration complexity, and the action available after scoring.
Monitor the model and the workflow
Concept drift occurs when customer behavior, product design, pricing, acquisition channels, or market conditions change. Monitor feature distributions, missingness, score distributions, calibration, segment performance, and eventual outcome rates. Retraining should follow evidence of decay and business change, not an arbitrary calendar alone.
A model can remain statistically stable while the workflow fails. Track whether a flagged customer reached the correct queue, whether a person or system delivered the intervention, whether the customer responded, and whether the account remained active afterward. These records form the feedback loop needed to improve both prediction and operations.
Make explanations useful
SHAP-style explanations can show which features pushed an individual prediction higher or lower. Customer success teams don't need a mathematical lecture. They need concise reason codes such as declining core usage, unresolved billing friction, or reduced adoption of a retention-critical feature, provided those reasons are valid and supported by the data.
Operational standard: Every score should have a timestamp, model version, feature snapshot, explanation, owner, action, and outcome.
Governance becomes essential when a churn score influences incentives, service priority, or outreach. Fintech and healthcare teams should document permitted uses, sensitive attributes, proxy risks, approval rules, and appeal paths. Validate performance across relevant customer groups, audit interventions for unequal treatment, and retain records that explain why a decision occurred.
For AI-assisted outreach, production observability should include prompt version, token usage, model cost, response latency, provider, and workflow grouping. A commercial prompt platform documents these mechanics as a way to connect each request to the prompt version that generated it and monitor spend and performance by operating context. Its documentation describes this prompt observability approach. Predictive scores and generated messages belong in the same accountable system, not in disconnected spreadsheets and chat windows.
Industry-Specific Integration Strategies
Ecommerce teams can send churn risk into email automation, loyalty journeys, and personalized offers, but the trigger should reflect the likely cause. A customer with declining purchase frequency may need product discovery or replenishment assistance, while a customer with payment failures needs a billing recovery path. Use customer value and margin to control incentives, and give merchandising teams a way to suppress offers that would subsidize customers who would've purchased anyway.
SaaS teams should connect account-level risk to customer success workflows and product-level signals. A high-value account with stalled onboarding deserves human outreach, while a lower-risk user who encounters a confusing feature may benefit from an in-app guide. Route reason codes to the team that can fix the issue, not merely to whoever owns the dashboard.
Fintech teams need strict governance around outreach, pricing, service prioritization, and sensitive attributes. A score can support proactive service, such as helping a customer resolve a failed payment or understand a product, but it shouldn't create unequal access to essential support.
Healthcare and digital health applications must protect patient information and design retention workflows around trust. Keep access controlled, minimize exposed data, document model use, and ensure that automated messages don't substitute for clinical judgment or create pressure around care decisions.
A practical intervention playbook maps risk and value to action:
- Lower risk: Use product education, onboarding reminders, and self-service guidance.
- Rising risk: Trigger contextual messaging, service recovery, or a targeted success check-in.
- High risk and high value: Assign a human owner, investigate the reason, and coordinate a targeted response.
- High risk with an external cause: Record the reason even when retention isn't possible, because the insight can improve forecasting and planning.
Measure net retention rate, customer lifetime value, intervention cost per saved customer, response time, and incremental outcomes against a control group. Model performance matters, but the program succeeds only when the business saves valuable customers without wasting trust, budget, or team capacity.
Wonderment Apps helps teams modernize existing web and mobile software with AI, predictive analytics, integrations, and scalable engineering support. Its prompt management system includes a versioned prompt vault, parameter management for internal database access, logging across integrated AI systems, and cost management for cumulative spend, making it relevant when churn workflows combine predictive scores with AI-assisted recommendations or outreach. Visit Wonderment Apps to discuss a production-ready retention application, modernization plan, or managed development team.