

Monday morning, the dashboard is already on the big screen. The team has charts for sign-ups, retention, feature usage, and campaign traffic, but nobody can answer the question in the room, why did users drift away after looking so active a few weeks earlier?
That gap is where behavioral analytics earns its keep. It turns clicks, flows, and outcomes into a usable story about what people are trying to do, where they hesitate, and which product decisions are worth making next. For teams building modern apps, it also becomes the cleanest bridge from raw product signals to AI personalization, recommendations, and anomaly detection, the same kind of bridge that makes a prompt management layer useful when you're trying to operationalize AI inside a real product stack.
The best mental model is simple. A dashboard tells you what happened, behavioral analytics helps you explain why it happened, and a good operating model helps you act on it without guessing. If you want a broader business-facing companion to that idea, the business intelligence guide by Querio is a useful read alongside this topic.
The Dashboard Trap Most Product Teams Fall Into
A product team can stare at a wall of charts and still miss the actual problem. That happens when the conversation stops at metrics and never reaches behavior. A retention line can dip for half a dozen reasons, and none of them are obvious if you only look at the aggregate.
The trap is subtle because dashboards feel productive. They're tidy, easy to share, and full of familiar labels like DAU, conversion, and bounce rate. But a chart is just a summary, not a diagnosis.
What teams usually miss
The missing piece is sequence. Users don't experience your product as a single number, they move through a path, hesitate, backtrack, and sometimes leave for reasons that don't show up in a top-level report. A growth team that knows this difference starts asking better questions, such as which step got easier, which screen created friction, and which cohort behaved differently from the rest.
Practical rule: if the dashboard says something changed, behavioral analytics asks what users did right before the change.
That's why good teams treat dashboards as a starting point, not an answer. They use them to spot movement, then go into event streams, cohorts, and journey paths to see what shifted. The discipline is less about counting users and more about understanding intent.
This is also where many teams get tempted to “fix” the product with intuition alone. That usually leads to patching symptoms. Behavioral analytics gives you a better loop, observe, interpret, test, then adjust the product experience with much less guesswork.
What Behavioral Analytics Actually Means
A product team usually notices behavioral analytics only after a pattern starts repeating. Users arrive, click around, hesitate, and leave, and the team needs a way to read those actions as evidence rather than noise. In digital products, that evidence shows up in page views, click-through rates, conversion rates, session duration, bounce rate, exit rate, daily active users, and user flow as defined in LinkedIn's behavioral analytics overview.
A working definition you can use in a meeting
Behavioral analytics is the discipline of collecting, joining, and interpreting user actions as quantitative signals so a team can understand engagement, retention, and funnel performance. The value comes from connecting those signals to decisions about what to change, what to keep, and what to personalize. In ecommerce, gaming, social media, and similar products, the point is to improve measurable results like conversion and retention.
A clean one-sentence version is this. Behavioral analytics connects what users do to what the business needs them to do next.
That makes it different from generic reporting. Traditional web analytics can tell you a page was viewed. Behavioral analytics asks what happened before and after, which cohort did it, and whether the journey helped or hurt the outcome. A chart summarizes; it doesn't diagnose.
For teams working through mobile products, a practical reference is this guide to mobile application analytics, because mobile behavior often makes the sequence problem easier to see. A tap path, a permission prompt, or a return visit can change the meaning of the same metric.
Don't confuse it with applied behavior analysis
The term can trip people up because it overlaps with clinical language. In applied behavior analysis, evidence-based practice means combining the best available evidence with client values, context, and clinical expertise as described in the NIH article. That belongs to a different field, but the overlap is useful, because both disciplines ask people to use evidence with judgment instead of treating a single number as the whole story.
For product teams, the useful takeaway is simple. Track the action, connect it to the journey, and use the result to decide what to build, fix, or personalize next. That same approach also supports the kind of data vs guesswork in design work that teams often debate before they have enough evidence.
Core Metrics That Move Decisions
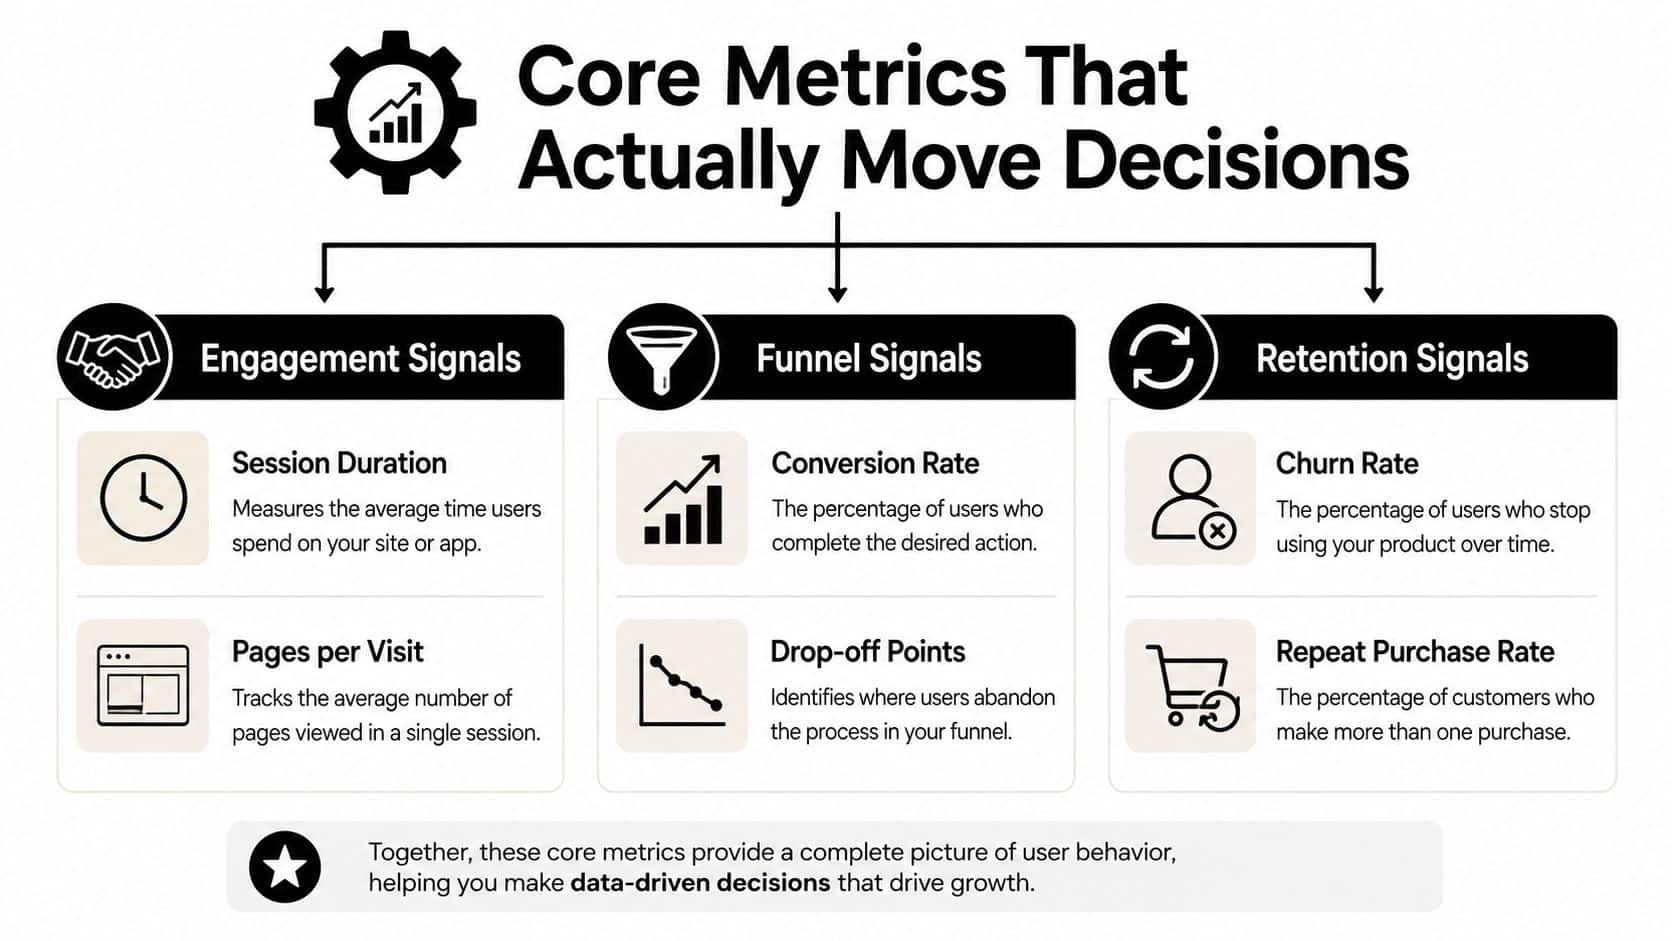
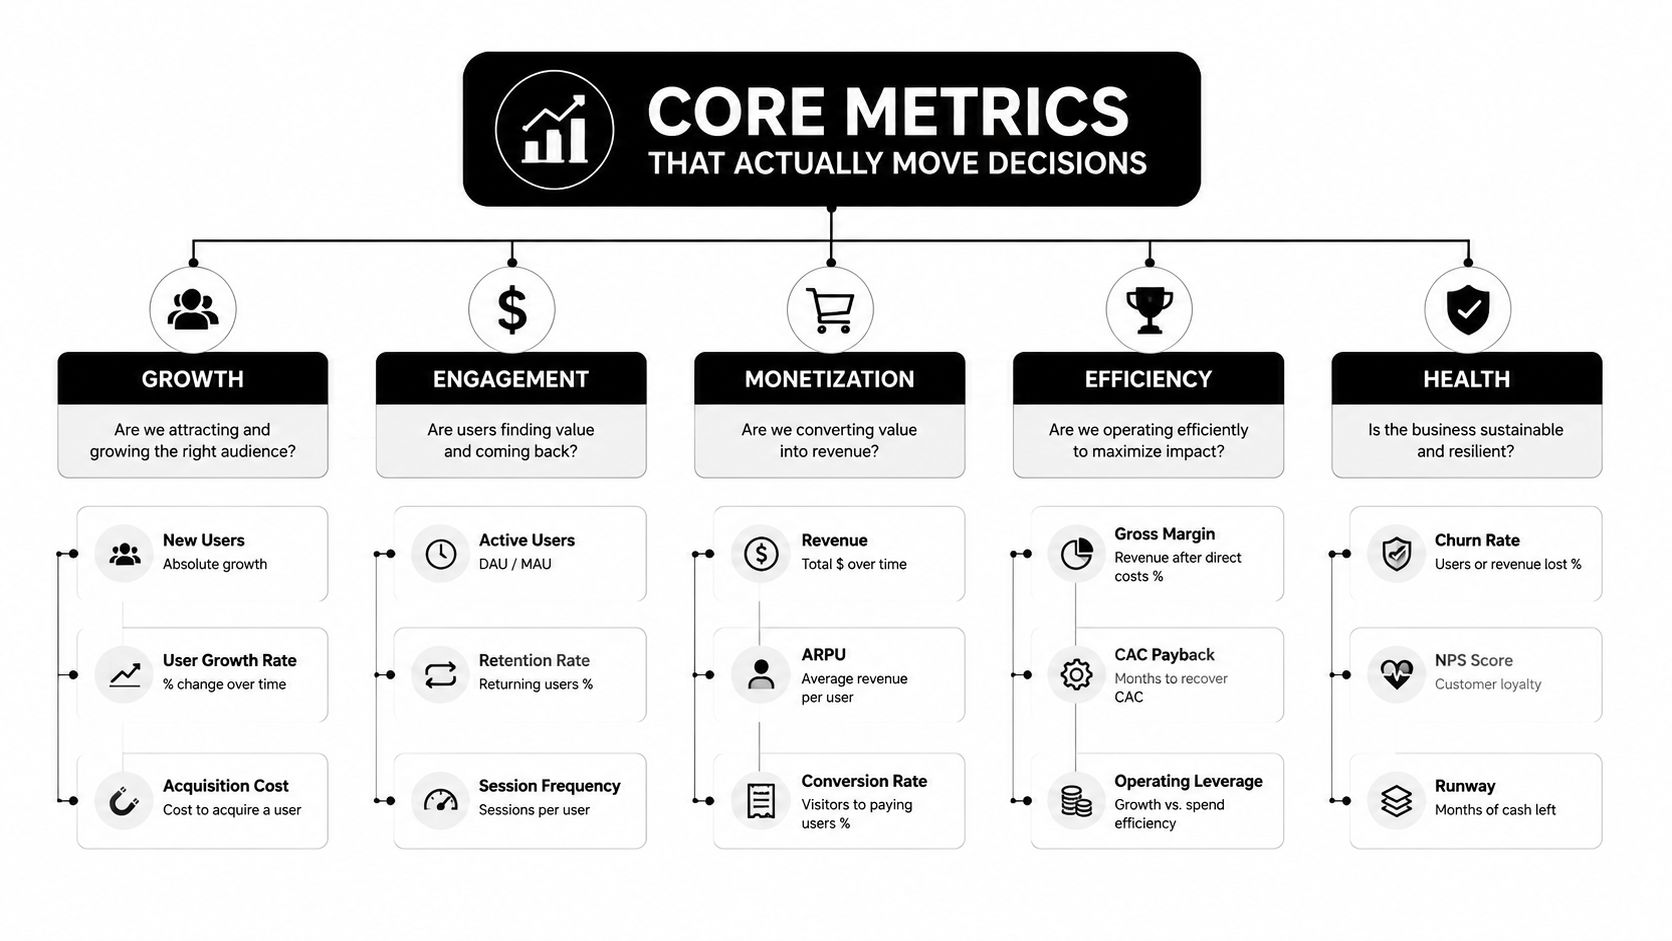
The easiest way to make behavioral analytics messy is to treat every event as equally important. A cleaner approach is to group signals by the decision they support. In practice, most useful metrics fall into three families, engagement, funnel, and retention.
Engagement signals tell you whether users lean in
Session duration and pages per visit can be useful, but only when they map to a meaningful action. A long session is not a win if the user is stuck. A short session is not a loss if the task was completed quickly. That is why engagement metrics should sit next to task completion, not replace it.
Daily active users is also easy to misuse. It can be a healthy signal, but it can also hide shallow usage if you do not pair it with cohort behavior. A product leader needs to know whether activity reflects real value or just repeated checking.
Mobile teams see this clearly because a tap, a permission prompt, or a return visit can change the meaning of the same count. For a practical companion, the guide to mobile application analytics helps translate those signals into product decisions.
Funnel signals tell you where the drop-off is
Conversion rate and drop-off points deserve their place on the dashboard because they point to a decision. If people are leaving at one step, the team can inspect copy, performance, permissions, or flow design. Behavioral analytics turns from observation into action at that point.
To sharpen that view, compare the leading and lagging sides of the same story. Click-through rates can hint at interest, while conversion tells you whether that interest became a result. One without the other can send the team in the wrong direction.
This is also where AI-driven personalization and recommendations become easier to evaluate. If a recommendation module gets attention but does not move users deeper into the flow, the signal is weak even if the surface interaction looks strong. Anomaly detection uses the same logic in reverse, because a sudden change in a step can matter more than the step itself.
Retention signals tell you whether the product earns a return visit
Churn rate and repeat purchase rate help teams judge whether an experience keeps its promise after the first interaction. These are rarely solved by one screen or one campaign. They usually reflect whether the product's core value is easy to reach and easy to repeat.
Retention also benefits from context that pure event counts cannot provide. Support notes, survey responses, and session replays help explain why people come back or drift away, especially when product changes alter behavior in ways a chart alone will miss. That is one reason data vs guesswork in design matters in review meetings, because the right interpretation can save a team from optimizing the wrong thing.
Do not decorate a slide with a metric unless someone can name the decision that metric changes.
A good rule is to use metrics as a filter. If a number does not help you compare cohorts, spot friction, or predict behavior, it is probably noise.
How Different Industries Use Behavioral Analytics
A product team usually sees the value of behavioral analytics first in one of four places, commerce, finance, healthcare, or media. The signals differ by industry, but the working method stays the same. Analysts observe patterns, compare cohorts, then act on the outcome that matters most for that setting.
| Industry | Key Behavioral Signals | Primary Outcome | Notable Constraint |
|---|---|---|---|
| Ecommerce | Cart activity, product views, conversion paths | Purchase completion and repeat buying | Personalization has to stay relevant without becoming creepy |
| Fintech | Login patterns, transaction sequences, device changes | Fraud detection and account safety | Monitoring has to balance security with trust |
| Healthcare | Appointment engagement, portal actions, adherence patterns | Better patient engagement and efficient service delivery | Tracking is shaped by compliance and privacy requirements |
| Media | Content paths, watch behavior, return visits | Longer sessions and reduced churn | Editorial choices depend on cohort-level reading or viewing patterns |
Ecommerce and fintech
In ecommerce, the most useful signals often sit between browsing and checkout. Teams watch cart recovery, recommendation relevance, and what people do after a purchase, because each step hints at whether the experience is building trust or losing it. A shopper who nearly buys is not the same as someone who leaves after the first view, and the difference shapes how product, marketing, and personalization systems respond.
That distinction matters even more once AI enters the stack. Recommendation models can make a storefront feel more relevant, but analysts still need to ask whether those suggestions move people deeper into the buying flow or just create a moment of curiosity. The same behavioral lens also helps teams spot when personalization starts to feel intrusive instead of helpful.
Fintech uses the same decision logic, but the problem is different. A strange login sequence, an unexpected device change, or a transaction pattern that breaks the normal baseline can matter more than a simple engagement metric. The useful question is whether the account behavior matches what a real owner would normally do, because that is where fraud detection, account safety, and anomaly detection start to overlap.
Healthcare and media
Healthcare teams care about patient engagement, appointment follow-through, and the small frictions that keep people from finishing a task in a portal. A missed form, a dropped scheduling flow, or a skipped reminder can matter as much as a failed transaction in commerce. The technical work is never just about collecting more data. It also includes deciding what should not be collected, shared, or inferred, because compliance and privacy shape the system from the start.
Media teams use behavioral cohorts to understand how people consume content over time. That helps editors and product teams see whether a story format, a recommendation model, or a sequence of topics encourages return visits. A streaming app does not need a generic “popular content” list if it can learn which audience segment keeps watching specific genres or formats, and which segment drifts away after a few touches.
Across all four industries, the decision style is the same, observe patterns, compare cohorts, and act on the outcome that matters most. The signals change, but the discipline does not.
Building the Technical Stack Step by Step
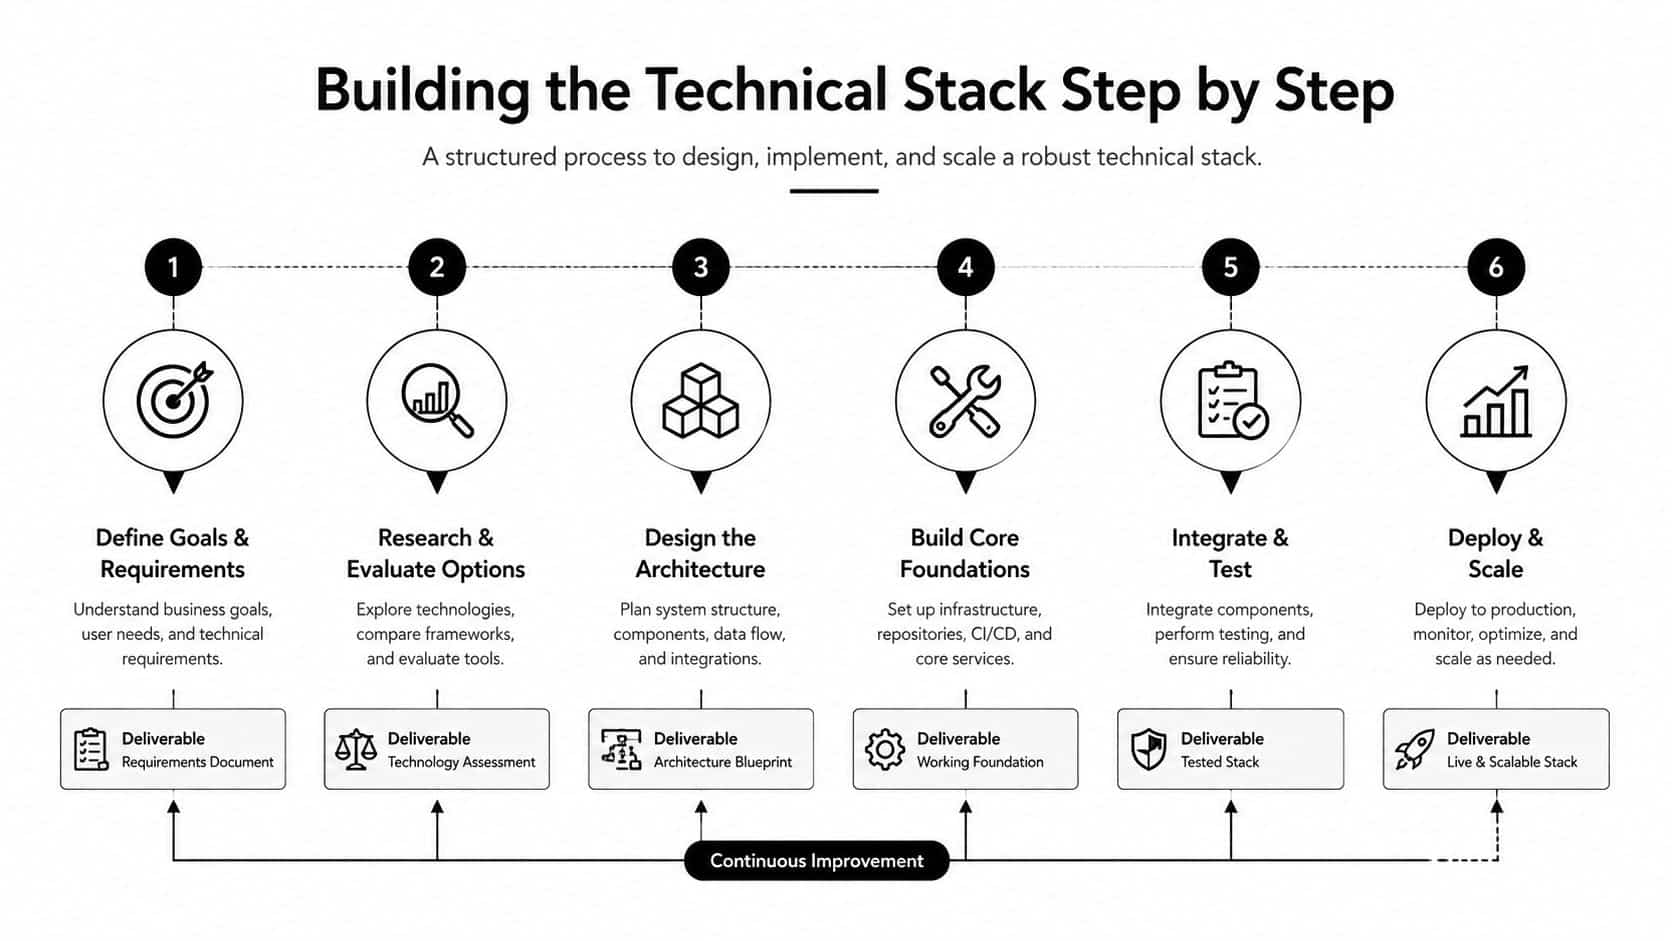
A behavioral analytics program works best when it's built like a system, not a pile of disconnected dashboards. Microsoft's implementation sequence is a strong blueprint, choose goals and KPIs, define the desired journey, decide which signals to track, combine transactional, demographic, and behavioral data into customer profiles, then implement a unified experience that supports machine learning models as Microsoft outlines.
Start with the journey, not the warehouse
The biggest mistake is starting with data storage before you know what question the product is supposed to answer. Define the user journey first. Then decide which events, properties, and identities are needed to see that journey clearly across web, mobile, and other touchpoints.
That's why the tracking plan matters so much. It gives engineering, product, and analytics one shared vocabulary for the events you will track, the names you will use, and the outcomes those events are supposed to support. If you skip this step, you end up with a noisy event firehose that's hard to trust.
Build the stack in the right order
A practical sequence looks like this.
- Pick the business goal. Choose the outcome first, such as onboarding completion, checkout progress, or feature adoption.
- Define the critical path. Map the few steps that matter most for that outcome.
- Instrument the events. Capture event-level sequences with timestamps, not just aggregate counts.
- Resolve identity. Tie sessions together so the same user doesn't look like five different people.
- Model the behavior. Start with descriptive cohorts, then move toward recommendations or predictions once the signal is stable.
A narrow funnel is usually better than trying to model the whole product on day one. Once the basic path is trustworthy, teams can widen the scope into journey analysis, cohort comparisons, and predictive models.
For teams wiring analytics into larger data systems, this article on data pipelines for business intelligence is a useful complement.
Track the smallest set of events that still lets you answer the business question.
The reason this sequence works is simple. It keeps the stack aligned to outcome-linked modeling instead of vanity reporting. That's how behavioral analytics turns into something a product team can use, instead of another system people visit only during monthly reviews.
Privacy, Drift, and the Limits of Quantitative Data
A behavioral analytics program can stall after launch for reasons that have little to do with the event schema. Consent rules, retention policies, and governance reviews decide what you can collect, how long you can keep it, and who is allowed to see it. The hard part is often policy, not instrumentation.
Teams working in security or regulated environments run into another issue, behavioral drift. Baselines age quickly when work patterns change, software changes, or seasonality changes how people use a product. Guidance from behavioral analytics security practice says those baselines need to be updated continuously, and that the technology works best when paired with SIEM, SOAR, or EDR rather than treated as a standalone detector as discussed by Reco.
A useful way to picture this is a smoke detector in a kitchen. If you never adjust for what normal steam looks like, it starts warning at the wrong moments. Behavioral models can do the same thing when the product, user mix, or operating context shifts faster than the baseline.
Why the numbers can lie without context
Quantitative signals are strong at showing what happened, but they can be weak at explaining why it happened. A user can engage heavily and still be dissatisfied. A cohort can look healthy and still be near churn. Interviews, observation, and contextual inquiry fill in the missing layer.
A peer-reviewed NIH article makes that gap explicit, arguing that single-case quantitative designs can be insufficient for questions like social validity and for broadening the range of topics behavior analysts can study in the article on qualitative methods. For product teams, the takeaway is practical. If the behavior and the sentiment disagree, do not assume the data is wrong. Assume the team is missing context.
One way to add that context is to pair analytics with interviews, support tickets, or session reviews, then compare the patterns side by side. That is also why teams that use analytics without Python or SQL often still need a qualitative read on the results. The dashboard can tell you where attention is concentrated, but it cannot always explain what the user was trying to do.
Governance questions to settle early
The strongest teams ask these questions before they ship, not after a privacy review blocks the rollout.
- What data do we need? Keep the event plan narrow until a clear use case proves more is useful.
- Who can see user-level behavior? Limit access to people who need it for an approved business reason.
- How long do we retain it? Set retention windows that fit the product and the policy.
- What happens when behavior changes? Decide how often models or baselines will be retrained.
- How do we explain the system internally? If a model drives action, product and legal teams should be able to describe the logic in plain language.
- How do privacy-by-design principles shape the workflow? Align data collection, consent, and retention with the approach laid out in privacy-by-design principles so policy decisions are made before implementation starts.
The core lesson is straightforward. Behavioral analytics survives only when the organization trusts how it is collected, interpreted, and used.
Where Wonderment Apps Fits Into Your Stack
Behavioral analytics gets more valuable when the signals drive product experiences, not just reports. That's where AI personalization, recommendations, and anomaly detection come in, because the data can move from insight to action. Wonderment Apps builds that kind of delivery layer by integrating best-fit AI models into custom software and pairing them with an administrative toolkit for prompt management, integrations, and token cost control.
The useful part for product teams is operational. A prompt vault with versioning helps teams keep AI prompts organized as products change. A parameter manager supports internal database access. A cross-model logging system makes AI activity more observable across integrations, and a cost manager shows cumulative spend so founders and product leads can keep an eye on usage as they scale.
What this looks like in practice
A team can use behavioral signals to trigger a recommendation, flag an anomaly, or personalize a workflow, then route those AI calls through a managed layer instead of scattering them across the codebase. That gives engineering a cleaner integration path and gives product a better way to see what the system is doing.
Wonderment Apps also fits naturally when a company wants behavioral analytics to connect to real product delivery, not just a standalone dashboard. In practice, that means bridging event-level data, AI logic, and the app experience so the system can respond to what users do.
The point isn't to add more AI. It's to make the AI calls traceable, maintainable, and tied to product behavior.
For teams planning a broader modernization effort, this is the part of the stack where analytics, integration, and delivery meet. The result is a product that can react to behavior without turning every new use case into a custom one-off.
Best Practices and Pitfalls Before You Ship
A good behavioral analytics setup starts small and stays disciplined. Start from an outcome, write the tracking plan before the events, and make sure the team agrees on what a successful path looks like. Then build only enough instrumentation to answer the current question.
The fastest way to avoid wasted work
Three habits save teams the most pain.
- Define the decision first. If the metric won't change a product choice, don't track it yet.
- Use cohorts deliberately. Averages hide the difference between a healthy segment and a struggling one.
- Treat governance as a feature. Privacy, consent, and retention aren't afterthoughts, they shape whether the system can live in the world.
The mistakes that keep showing up
The most common failure mode is tracking everything and learning nothing. Another is shipping personalization on dirty or poorly named data, which makes the AI layer look unreliable even when the problem is upstream. Teams also get stuck when they ignore the qualitative layer and assume a strong metric means users are satisfied.
A useful planning question for this week is simple. What user journey are we trying to improve, and what is the smallest set of signals that would let us prove it?
If your team is ready to turn behavioral signals into product decisions, Wonderment Apps can help design the app layer, integrate the AI plumbing, and keep the prompt-driven pieces observable as the product grows. Visit Wonderment Apps to explore how that stack can fit into your next build or modernization project.