

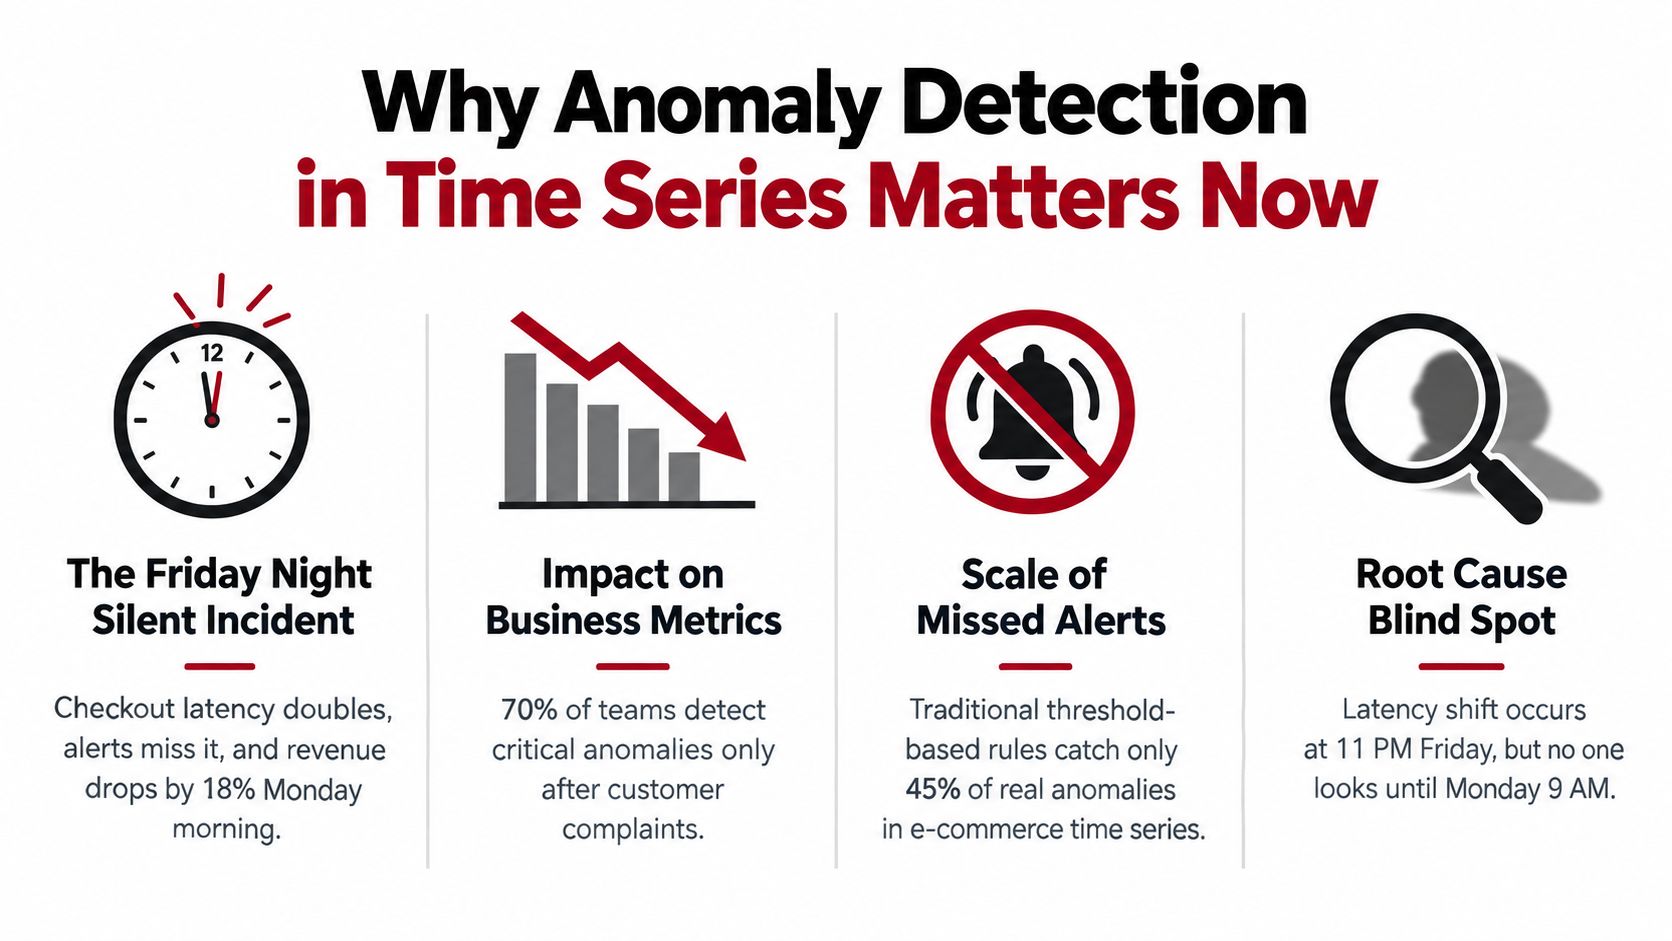
Friday evening, a checkout service starts taking twice as long to respond. The existing alert checks whether latency has crossed a fixed limit, so nothing fires. By Monday morning, the product team sees the commercial impact, support has a queue of complaints, and nobody can say exactly when the failure began.
That's the operational reality behind anomaly detection time series work. A useful detector doesn't merely label unusual values. It helps a team recognize a changing pattern, assess its business impact, investigate the likely cause, and route a clear response. The technical model matters, but so do thresholds, data quality, feedback loops, and the software around the model.
For teams adding AI to custom web, desktop, or mobile applications, this creates another layer of complexity. An AI workflow needs controlled prompts, reviewable changes, access to the right internal data, and visibility into usage costs. Wonderment Apps' prompt management system is designed for that administrative layer, with prompt versioning, parameter management, logging across integrated AI systems, and cost tracking. The point isn't to make every detection problem an LLM problem. It's to give product teams a way to manage AI steps that sit around detection, such as incident summaries and analyst assistance.
Why Anomaly Detection in Time Series Matters Now
A Friday-night incident rarely arrives as a dramatic red error. More often, a metric bends. Checkout latency rises, successful payments soften, and a monitoring rule keeps waiting for a single value to cross a threshold. By the time someone investigates, the original signal is buried under logs, deploys, traffic changes, and unrelated alerts.
Modern applications produce streams from payment services, mobile clients, databases, queues, recommendation engines, and third-party APIs. Microservices multiply the number of signals that teams must interpret, while AI-generated traffic can create patterns that don't resemble historical workloads. A fixed rule such as “page when latency exceeds X” can't easily distinguish a normal campaign surge from a slow dependency failure.
The toolkit has more than one layer
A practical system usually combines several approaches:
- Statistical baselines: Estimate expected behavior from recent history, seasonal patterns, or residual values.
- Classical machine learning: Learn boundaries around normal observations or classify engineered features.
- Deep learning: Model complex temporal relationships through forecasting, reconstruction, or generative techniques.
- Streaming infrastructure: Consume events continuously, update context, and deliver alerts within the team's response window.
No model can rescue a pipeline that drops timestamps, mixes units, or delays events until the alert is already stale. Product engineers need to treat detection as a software capability, not a notebook experiment. That means defining the event contract, storing the score and decision, exposing the evidence to reviewers, and connecting the alert to an owner.
Practical rule: An anomaly alert has value only when someone knows what to check, who owns the response, and what action follows.
An integrated AI administration layer can help when detection feeds downstream workflows. For example, a system might send a scored event to an AI assistant that summarizes the change for an on-call engineer, retrieves relevant deployment context, or drafts a customer-support note. Wonderment Apps' tooling can support this kind of workflow through a prompt vault with versioning, a parameter manager for internal database access, logging across integrated AI systems, and a cost manager for cumulative spend. Those controls make experiments easier to review before a team places them inside a production application.
Core Concepts Behind Time Series Anomaly Detection
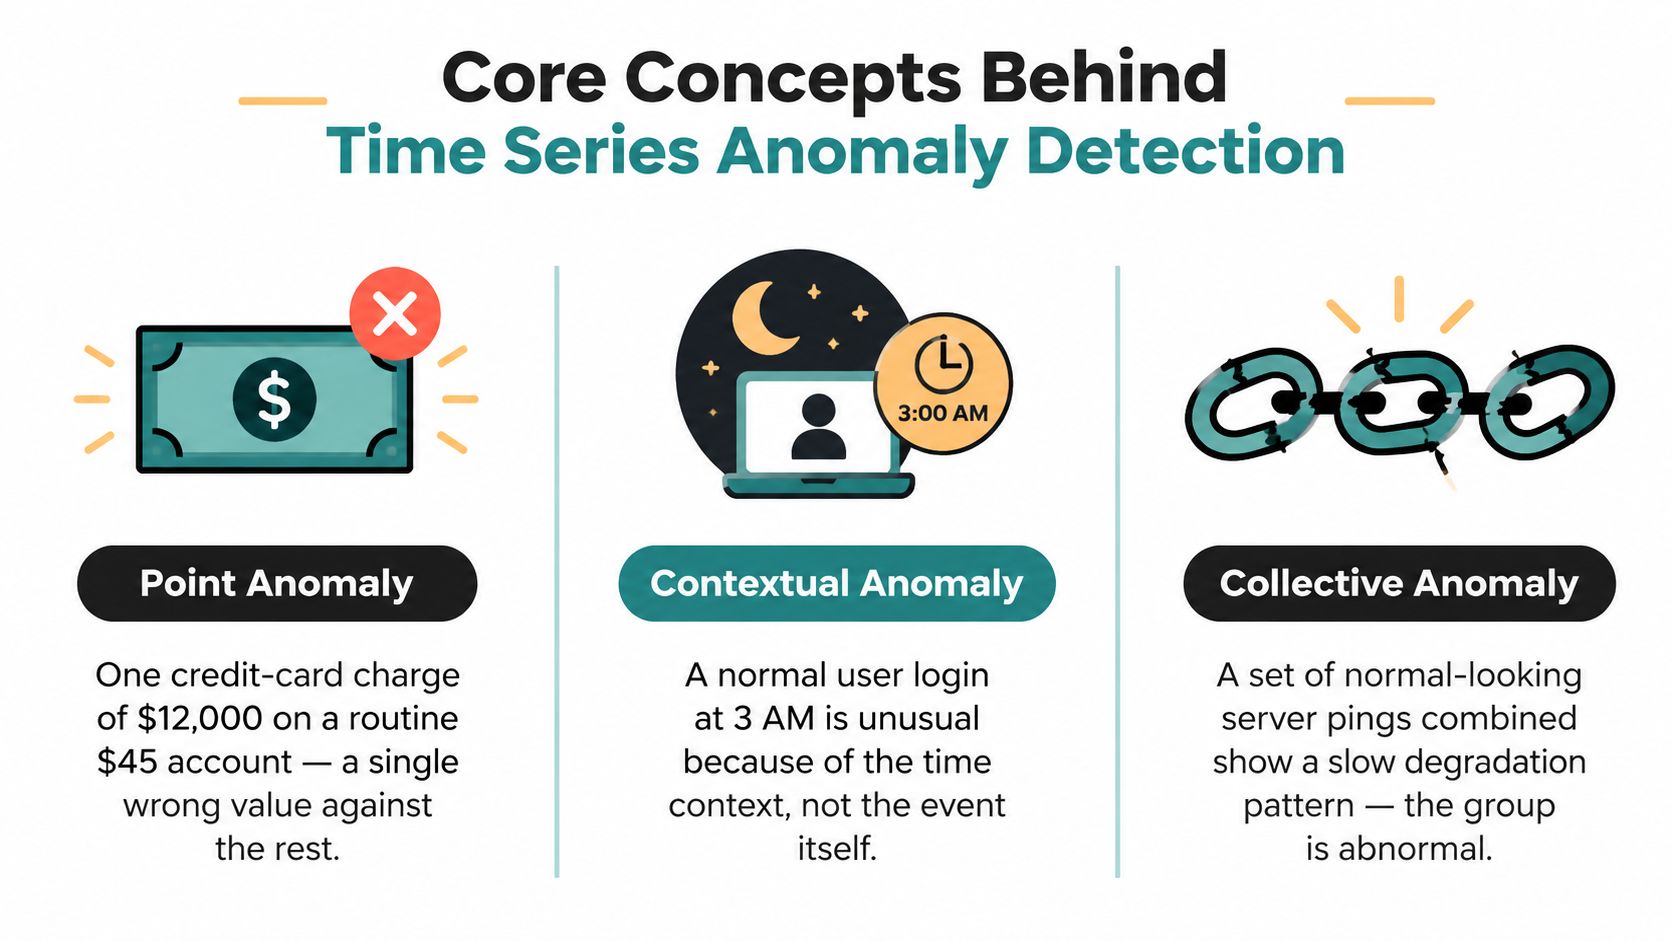
Start with the question, “What counts as unusual here?” The answer depends on the shape of the event and the context around it. A single value can be wrong, a normal value can be strange at a particular time, or a sequence of individually ordinary values can become abnormal as a group.
Three kinds of anomalies
- Point anomaly: One credit-card charge is dramatically larger than the account's usual purchases. The value stands out against nearby observations.
- Contextual anomaly: A login might be ordinary during the day but suspicious at three in the morning for that user. The event becomes unusual because of its time or operating context.
- Collective anomaly: Individual server pings may look acceptable, yet a sequence can reveal gradual degradation. The group, not one isolated point, carries the signal.
This classification changes the implementation. A point detector can inspect a value against a local distribution. A contextual detector needs features such as hour, device, region, or operating mode. A collective detector needs windows, sequences, or a model that can recognize shape over time.
Trend, seasonality, and residual behavior
A trend describes the broad direction of a signal. An application's daily active users may rise as adoption grows. Seasonality describes a repeating rhythm around that direction, such as a predictable busy period during the day or a recurring weekend pattern. Noise is the remaining variation after the expected structure has been accounted for.
A useful mental model is:
observed signal = trend + seasonality + residual
The residual is often where a detector looks for surprises. If traffic normally rises every morning, a morning spike may not be anomalous. If the same spike appears outside the expected pattern, its residual becomes more interesting.
You'll also hear the term stationarity. Informally, a stationary series behaves as though its basic statistical properties remain reasonably stable over time. Many classical methods work better when the average, spread, and relationships in the signal don't move too quickly. Teams can sometimes make a series easier to model by differencing it, transforming it, or analyzing residuals after decomposition.
For a broader treatment of decomposition, smoothing, and forecasting, see time series analysis techniques. The important design decision is to define the expected behavior before choosing the detector. Otherwise, the model may learn a mixture of growth, calendar effects, outages, and data errors as if they were one normal pattern.
Algorithms from Statistics to Deep Learning
Algorithm selection should follow the operational constraint, not the newest paper title. A lightweight statistical detector may be easier to explain and faster to run than a neural network, while a complex model can earn its cost when the signal contains nonlinear relationships or many interacting variables.
Compare the families
| Algorithm Family | Data Needed | Strengths | Best Fit |
|---|---|---|---|
| Statistical methods | A clean history, often with a stable baseline or decomposable seasonality | Fast, interpretable, and easy to inspect | Single metrics, early prototypes, and systems with tight latency requirements |
| Classical machine learning | Normal examples plus engineered features, or labeled incidents for supervised learning | Flexible decision boundaries and modest serving cost | Operational tabular features, multivariate summaries, and teams with useful labels |
| Deep learning | More history, careful preprocessing, and training infrastructure | Learns complex temporal structure and nonlinear relationships | Rich signals, difficult seasonality, reconstruction tasks, and high-volume environments |
Statistical workhorses include z-scores and modified z-scores applied to residuals, rolling baselines, seasonal decomposition, and ARIMA-style forecasts with confidence bands. A Seasonal Hybrid ESD-style test can help with long seasonal series when the team can describe the seasonal structure and tolerate a more analytical workflow. These methods are attractive because an engineer can often explain the alert in plain language: “The residual is far outside the recent expected range.”
Classical machine learning expands the feature space. Isolation Forest can flag observations that are easy to isolate, while One-Class SVM learns a boundary around normal behavior. With labeled incidents, a supervised model can use features such as recent slope, rolling variance, error rate, deployment state, and dependency health. The trade-off is that feature engineering becomes part of the model's maintenance burden.
Deep learning offers LSTM and Transformer forecasters, autoencoders that use reconstruction error, and newer foundation-model directions for time series. These systems can capture relationships that hand-built features miss, but they require more history, more tuning, and stronger monitoring. Training and inference costs can also complicate mobile or edge deployments, where latency, battery, and network availability matter.
Choose complexity only when the simpler baseline has failed for a documented reason.
A good build sequence is to establish a transparent baseline, record false alerts and missed incidents, then test a more complex model against the same operational criteria. That approach gives the product team a reference point instead of asking it to trust a black box from day one.
Evaluation Metrics That Actually Reflect Operations
Accuracy is a poor default for anomaly detection. The normal class usually dominates, so a detector can look successful while missing the incidents the business cares about. A team that evaluates only pointwise accuracy may reward a system that flags isolated values aggressively or ignores the timing and duration of a real event.
The UCR Time Series Anomaly Archive provides a more reliable evaluation setting: it contains 250 curated univariate time series across many domains and was introduced to replace noisier anomaly corpora with error-free ground truth. The benchmark quality matters because the dataset shapes measured performance and comparability across papers, as described in the UCR archive research.
Read the metrics as operating decisions
| Metric | What It Measures | Best Use Case |
|---|---|---|
| Precision | How many alerts correspond to real anomalies | Controlling alert fatigue and protecting on-call attention |
| Recall | How many real anomalies the detector catches | Measuring the cost of missed incidents |
| F1 | A balance between precision and recall | Comparing systems when both error types matter |
| Range-aware scoring | How well the detector identifies an anomalous interval, including partial or delayed detection | Evaluating outages, degradation windows, and other contiguous events |
Precision answers, “When we page someone, how often is the alert useful?” Recall answers, “Of the incidents we care about, how many did the system identify?” F1 combines both, but it still needs interpretation. If a missed payment outage is much more expensive than an unnecessary investigation, the team may accept lower precision to improve recall.
Threshold choice changes every one of these measurements. Literature on time-series anomaly detection recommends precision, recall, F1, and range-based variants rather than pointwise accuracy alone because isolated over-flagging can produce misleading scores, while sequence-aware metrics better represent contiguous anomalies and delayed alerts. See the threshold-sensitive evaluation literature.
Use a precision-recall curve to choose a threshold with the incident owner, not in isolation. Then test it against labeled operational windows, including delayed alerts, missing data, and overlapping events. A useful evaluation review also asks whether the detector identifies the start of an incident early enough to change the response.
For a wider framework covering model quality, error analysis, and production criteria, use this AI model evaluation guide. The headline score is only the beginning. The key question is whether the score predicts a better decision.
Streaming, Generalization, and the Real Deployment Gap
A model trained on a static dataset can still fail in production before its first useful alert. Live systems face changing customer behavior, new releases, altered sampling intervals, missing events, delayed records, and shifting definitions of normal. The engineering team must maintain the stream while the detector observes it.
A recent survey identifies streaming data, human-in-the-loop review, point processes, contextual anomalies, and population-level analysis as open challenges in deployed anomaly detection. That framing matters because the difficult work often happens outside the model architecture. The survey of operational anomaly detection challenges treats these deployment questions as unresolved areas rather than finished practices.
Streaming changes the design
A batch detector can calculate a score after the full dataset arrives. A streaming detector must make decisions with incomplete context and a latency budget. It also needs a policy for concept drift. If the application changes its traffic mix, the detector must distinguish a legitimate regime shift from a service failure.
Human review can turn this limitation into a feedback loop. Give an analyst the event, score, relevant context, and a simple way to mark “real incident,” “expected change,” or “bad data.” Store that decision with the original input and model version. The labels won't be perfect, but they create a path for threshold tuning, retraining, and error analysis.
Cross-domain transfer remains difficult
A detector trained on payment volume won't automatically understand a healthcare sensor, a retail conversion series, or an industrial vibration signal. The 2025 ICLR paper on general time-series models states that existing methods typically require one model per dataset and identifies two major challenges: choosing an information bottleneck for heterogeneous data and distinguishing multiple normal and abnormal patterns within one unified model. See the ICLR paper on general time-series anomaly detection.
Foundation models may improve reuse, but they don't remove domain shift, scarce labels, or privacy constraints. Teams should plan for adaptation, validation, and access controls rather than assume one universal detector will work reliably everywhere. Practical guidance on building the surrounding pipeline is available in this overview of anomaly detection systems.
Best Practices for Monitoring and Maintenance
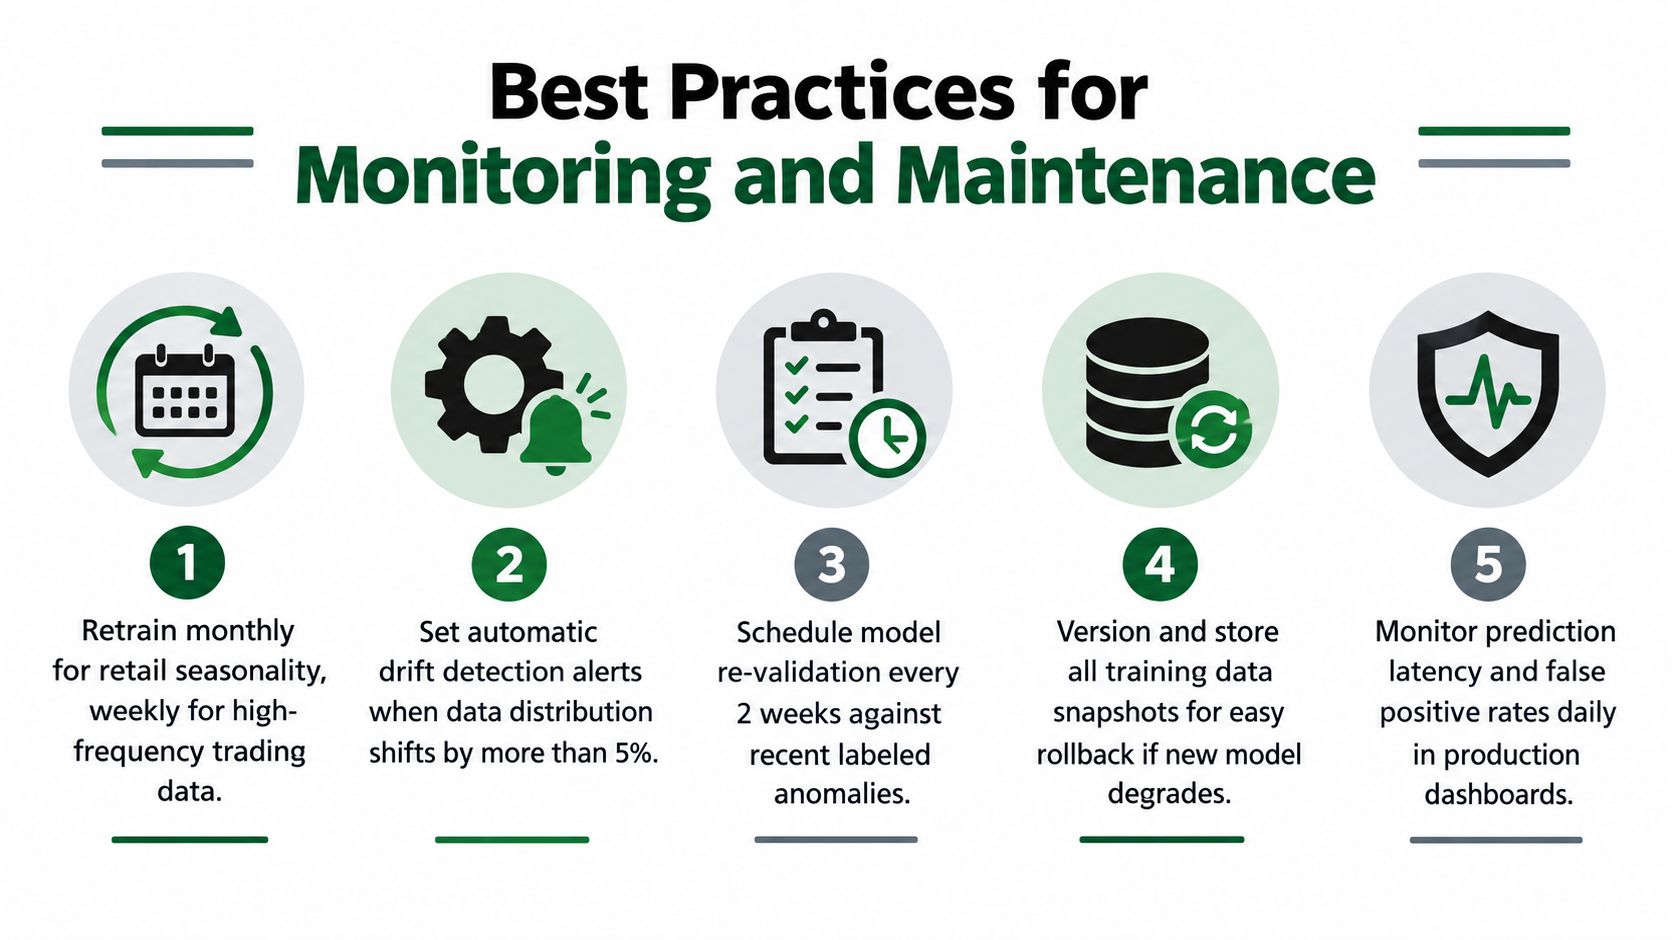
Production detection needs a maintenance plan before launch. A model can remain available while its inputs change, its threshold becomes irrelevant, or its alerts stop reaching the person who can act.
Use this checklist during design reviews:
- Tie retraining to behavior: Schedule updates around meaningful seasonality or regime changes. A retail signal may need a different cadence from a volatile financial stream, so choose based on drift and incident history rather than an arbitrary calendar.
- Route by business effect: Page an on-call engineer for a payment failure pattern, send a lower-severity trend to a team channel, and reserve email for reviewable notifications. A raw anomaly score shouldn't decide the escalation path by itself.
- Capture the evidence: Store input summaries, timestamps, model version, threshold, score, decision, and eventual reviewer outcome. Without that record, the team can't explain why an alert fired or diagnose a silent failure.
- Release cautiously: Run a new detector in shadow mode first. Compare its alerts with the current system, then use a canary rollout before changing the production response path.
- Protect the data contract: Validate schemas, units, timestamp order, missing values, and backfill behavior. A detector can report “normal” because the upstream job stopped delivering fresh data.
Maintenance is part of the product
Dashboards should show more than model output. Include input-distribution changes, score distributions, alert volume, response outcomes, and serving latency. When reviewers label an alert, preserve the label with the relevant time window so future evaluations don't reduce a sequence to one point.
A sensible runbook also defines rollback. Keep versioned training snapshots, model artifacts, threshold settings, and configuration together. If a new model produces noisy alerts, the team should be able to restore the previous detector without reconstructing its state from scattered notebooks.
A detector without observability is a second monitoring problem disguised as a solution.
Ecommerce and Fintech Use Cases in Practice
Consider an ecommerce checkout funnel. Cart additions remain steady, but checkout completions fall while payment latency climbs. A rolling residual detector or forecast model can identify the joint change, but the alert should include deployment status, payment-provider health, browser or device breakdowns, and the affected funnel stage. The on-call engineer investigates service dependencies, while merchant operations checks whether a promotion or inventory rule created an expected shift.
A different ecommerce pattern appears during a campaign. Traffic rises sharply, but the increase comes from a bot source and inventory reservations move out of alignment with completed orders. A contextual detector that includes campaign, channel, region, and product availability can separate a legitimate promotion from suspicious traffic. The response may belong to growth, fraud, or platform engineering, depending on which context explains the deviation.
Fintech teams face similar patterns with stricter audit requirements. A payment processor outage can appear as a volume drop, an increase in retries, or a reconciliation break between internal ledgers and processor records. Unusual withdrawal behavior may need an analyst review rather than an automatic block, while trading-platform latency can require immediate engineering escalation.
| Domain | Anomaly Signal | Detection Approach | Response Owner |
|---|---|---|---|
| Ecommerce | Cart abandonment rises alongside checkout latency | Seasonal baseline plus contextual features | Product operations and on-call engineering |
| Ecommerce | Inventory and completed-order counts diverge during a campaign | Rolling residual analysis with campaign context | Merchant operations and growth |
| Fintech | Transaction volume falls while retries increase | Forecasting baseline with dependency metadata | Payments engineering |
| Fintech | Withdrawal sequence differs from the account's normal behavior | Contextual and collective detection with analyst review | Fraud operations |
| Fintech | Ledger totals fail to reconcile with processor records | Rule-based reconciliation plus anomaly monitoring | Finance controls and platform engineering |
The model family should follow the response window. A transparent statistical method may be enough for a clean operational metric. A richer sequence model can help when the anomaly depends on shape, context, or interactions across signals.
Domain knowledge also changes the threshold. Ecommerce teams need to account for promotions, holidays, and merchandising changes. Fintech teams need reproducible evidence, access controls, and an audit trail for decisions. In both settings, the alert should explain the signal in terms the owner can act on, not merely display an opaque score.
Key Takeaways and How to Move Forward
A dependable anomaly detection time series system follows a few durable principles:
- Define the anomaly first: Decide whether the problem is point, contextual, or collective.
- Start with the simplest suitable model: Prefer transparent statistics when they meet the latency and explanation requirements.
- Evaluate operationally: Use precision, recall, F1, and range-aware measures on labeled incident windows.
- Design for streams: Expect drift, late data, changing regimes, and incomplete context.
- Build a feedback loop: Let reviewers label alerts and preserve those decisions for future validation.
- Plan maintenance: Monitor inputs, scores, latency, alert outcomes, retraining, and rollback.
- Connect detection to action: Every alert needs an owner, evidence, severity, and response playbook.
The field is moving toward foundation models for time series, LLM-assisted root-cause analysis, and tighter integration with feature stores and observability platforms. Those directions are promising, but generalization across domains remains unreliable. The strongest teams will combine model experimentation with careful data contracts, evaluation discipline, and human review.
When anomaly detection feeds an AI workflow, prompt governance becomes part of engineering quality. Wonderment Apps' prompt management system can help teams version prompts, manage parameters for internal data access, log integrated AI activity, and track cumulative costs as detection events trigger summaries or incident-response assistance.
Wonderment Apps helps teams modernize web, desktop, and mobile software with AI integrations, scalable engineering, and managed prompt workflows for use cases such as anomaly detection and incident response. Visit Wonderment Apps to explore the platform and request a demo for your application.