


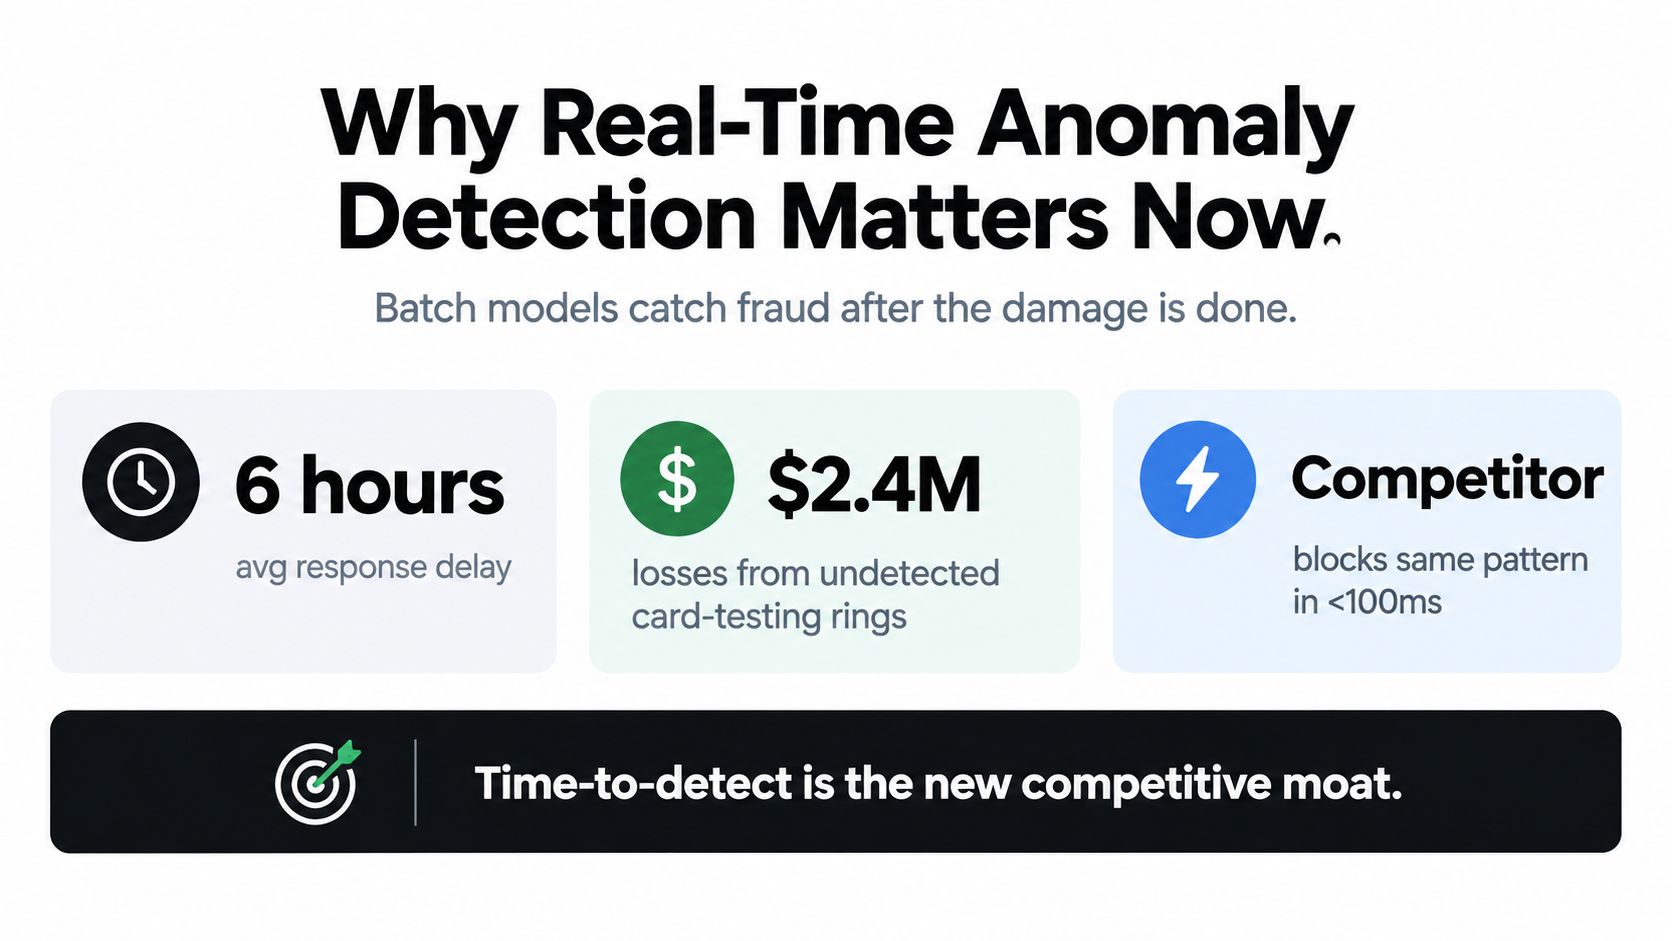
A payments team opens its morning dashboard and finds a card-testing ring that started during the night. The fraud model ran in a batch window, so the alert arrived six hours after the attackers had tested cards, triggered declines, and moved on. A real-time system would have treated the pattern as a decision to make while transactions were still in motion, not as a report to review later.
That distinction also applies to ecommerce checkouts, clinical telemetry, application logs, ad delivery, and industrial sensors. Real-time anomaly detection flags behavior that departs from an expected pattern inside a response window defined by the cost of waiting. The model matters, but it comes after the operational question: can the business act before the event completes?
A prompt management layer can help teams operationalize the AI around those alerts. Wonderment Apps' administrative tool includes a prompt vault with versioning, a parameter manager for internal database access, logging across integrated AI systems, and a cost manager for cumulative spend. That kind of control becomes useful when an anomaly needs more than a score, such as an explanation, a case summary, or a recommended action.
Why Real-Time Anomaly Detection Matters Now
The phrase “real time” is easy to misuse. A system that identifies a suspicious payment after settlement may be fast by reporting standards, but it isn't real time from a fraud prevention perspective. The useful question is whether the signal arrives while a payment gateway can still challenge, decline, or route the transaction for review.
Market forecasts show why this capability has moved beyond specialist analytics. The broader anomaly detection market was estimated at USD 4.33 billion in 2022 and projected to reach USD 14.59 billion by 2030, representing a 16.5% CAGR from 2023 to 2030, according to Grand View Research's anomaly detection market analysis. More recent estimates cited in the same market coverage place the sector at USD 6.98 billion in 2025, with a projected rise to USD 28.15 billion by 2034. Another forecast places the market at USD 7.63 billion in 2026 and USD 16.63 billion by 2031, implying a 16.86% CAGR. These estimates differ in scope and methodology, but they point in the same direction: organizations increasingly need detection embedded in security, operations, and monitoring workflows.
The technical shift is architectural as much as statistical. Earlier systems commonly analyzed stored datasets in offline jobs. Online inference processes events as they arrive, often inside time windows, so the detector can update its view of normal behavior without waiting for a batch pipeline. Engineering coverage of unsupervised real-time anomaly detection describes this move toward quasi-real-time and online prediction across logs, metrics, video, fraud signals, and industrial telemetry.
Practical rule: Define the response window before choosing the algorithm. An accurate alert that arrives after the business action has expired is an expensive dashboard ornament.
Latency budgets vary by use case. Independent coverage frames under approximately 200 milliseconds as useful for prevention, 200 to 500 milliseconds for interception, and responses above one second as more appropriate for investigation than immediate action, as discussed in this analysis of real-time anomaly detection for video surveillance. The implication is straightforward. Start with the action, then design the stream, features, model, and review process around it.
The Four Main Detection Approaches Compared
No algorithm wins across every stream. A request-rate monitor with stable seasonality needs a different tool from a multivariate fraud detector that must adapt during a promotion.
Statistical methods remain the best first move for many operational metrics. Z-scores, EWMA, moving baselines, rate-of-change checks, and seasonal decomposition are inexpensive and easy to explain. They work well when the signal has a stable shape, such as latency, request volume, sensor readings, or order counts. They weaken when several variables interact, the baseline shifts quickly, or the stream contains sparse and irregular events.
Classical machine learning earns its place when feature relationships become richer. Isolation Forest and one-class SVM can identify unusual observations without extensive labels, while supervised models such as gradient-boosted trees become attractive when incident outcomes are available. These models often offer a practical balance of inference cost, feature-level explanations, and operational maturity.
Streaming and online models update as events arrive. River-based implementations and online gradient descent can respond to concept drift more directly than a frozen batch model. The trade-off is governance. Teams must define how features evolve, how updates are validated, and what happens when a promotion or outage temporarily changes normal behavior.
Deep learning can capture complex temporal and multivariate patterns through LSTMs, transformer encoders, and autoencoders. It can be justified when simpler baselines repeatedly miss the hard cases, but it adds compute, monitoring, retraining, and explanation requirements. A 2026 review highlights continuing challenges around extreme class imbalance, hard real-time processing, explainability, and the lack of standardized database-specific benchmarks, as documented in the large-scale anomaly detection review.
Detection approaches at a glance
| Approach | Best For | Latency Cost | Explainability | When It Earns Its Keep |
|---|---|---|---|---|
| Statistical | Stable metrics and clear baselines | Low | High | The first production baseline |
| Classical ML | Rich features and known incident patterns | Low to moderate | Moderate to high | Simple rules stop separating normal from suspicious behavior |
| Streaming and online | Non-stationary event streams | Low to moderate | Moderate | Drift makes static models stale |
| Deep learning | Complex temporal and multivariate signals | Moderate to high | Lower | Simpler models plateau on important failure modes |
For physical assets, model selection should sit inside a broader maintenance process rather than operate as an isolated alerting experiment. A practical resource on condition monitoring program design is useful because it connects detection with asset context, escalation, and maintenance decisions.
The decision rule is deliberately conservative: start statistical, graduate to classical ML, add online learning when drift becomes material, and use deep learning only when measured evidence justifies the added complexity.
Inside the Streaming Architecture That Makes It Work
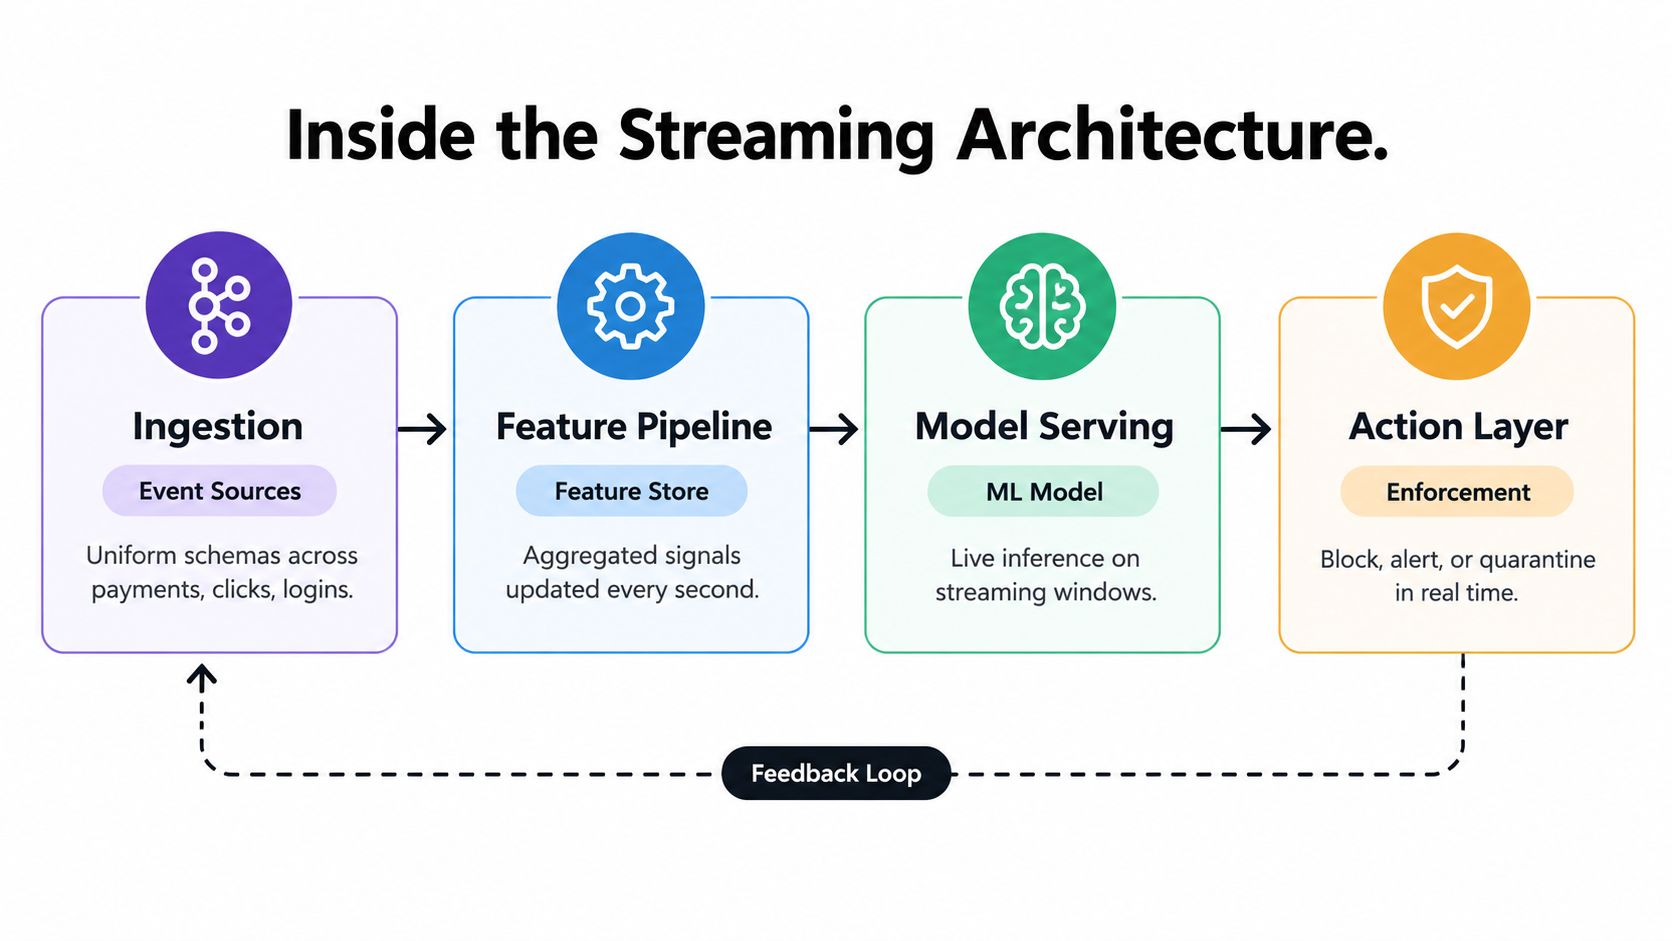
A useful architecture has four layers. Ingestion receives events, the feature pipeline turns them into signals, model serving assigns scores, and the action layer decides what the organization does next.
Start with consistent events
Events may arrive through Kafka, Amazon Kinesis, Google Cloud Pub/Sub, or webhooks. The first design decision isn't which broker to choose. It's deciding what every event must contain, such as an event time, entity identifier, event type, source, and correlation key.
Keep raw events when investigators may need to reconstruct what happened. Aggregate signals when storage, privacy, or throughput makes raw retention impractical. Backpressure handling matters because a detector that falls behind can produce stale scores while appearing healthy.
Build features that respect time
Flink, Spark Structured Streaming, and managed streaming services can calculate rolling windows, joins, and embeddings. A payment feature might combine recent transaction velocity, device history, and merchant context. An ecommerce feature might compare current checkout behavior with a customer's recent session pattern.
Point-in-time correctness is essential. A feature must use only information available before the decision, otherwise offline evaluation will look stronger than production performance. The system should also expose feature freshness, missing values, and late-arriving events as first-class monitoring signals.
Serve two model paths
Lightweight models can score inline inside a stream processor when the decision needs very low latency. A richer model can run behind a low-latency API when the system has time for additional features or contextual inference.
Don't force every event through the expensive path. Use staged detection instead. A cheap statistical gate can filter ordinary traffic, while a more expressive model investigates a smaller set of candidates and an AI assistant summarizes evidence for a human reviewer.
Teams building this foundation may also benefit from Wonderment Apps' guide to real-time data processing, particularly when connecting application events to scalable processing services.
The final layer turns an anomaly into value. It can block, throttle, quarantine, route to a queue, open an incident, notify an operator, or do nothing while collecting evidence. That decision should include confidence, severity, customer impact, and reversibility.
The action layer isn't plumbing. It is the product. Many anomaly programs fail because the alert reaches the wrong queue, lacks context, or gives an operator no safe next step.
Latency, False Positives, Explainability, and Compliance
A detector needs a latency budget tied to a business action. Fraud prevention may require a sub-100ms path, while a customer-support intervention can tolerate a longer response. Investigation workflows can accept minutes, and reconciliation can remain batch-oriented.
The thresholds below are operating categories, not universal engineering benchmarks. Each one changes the acceptable model complexity, false-positive cost, and review process.
| Concern | Sub-100ms Tier | 1-5s Tier | Minutes Tier | Batch Tier |
|---|---|---|---|---|
| Primary action | Block or allow | Intercept or intervene | Investigate or review | Reconcile and retrain |
| Model preference | Inline statistical or lightweight ML | Enriched streaming model | Heavier contextual model | Offline ensemble or deep analysis |
| False-positive tolerance | Lowest | Low to moderate | Moderate | Higher, with human review |
| Explanation style | Compact reason code | Feature summary | Full case context | Detailed audit analysis |
| Reliability priority | Fail-safe routing | Fast fallback behavior | Queue durability | Reproducibility and completeness |
False positives become concrete when attached to labor. If a model fires 10,000 alerts per day and each takes 90 seconds to triage, the review burden is 250 hours of human attention per day. That arithmetic is based on the alert and triage assumptions in the operating scenario, not a market benchmark. The lesson is practical: measure alert volume, handling time, escalation rate, and downstream loss together.
Explainability needs multiple layers. Global feature importance helps governance teams understand broad model behavior. Local SHAP values or counterfactuals can show an analyst why one event received a score. An immutable audit log should preserve the input context, model version, score, action, and human override.
Compliance changes what data can enter the feature pipeline. GDPR encourages data minimization and purpose limitation. PCI considerations affect payment-data scope. HIPAA matters when patient signals are involved. Financial services teams also need model risk documentation that covers validation, change control, monitoring, and human oversight.
A 2026 study of embedded anomaly detection argues that teams often report accuracy or F1 on static datasets while neglecting latency, RAM, power, model-update overhead, portability, and human-in-the-loop design. Those omissions matter most when the detector must run close to the device or support a regulated operational decision.
Real-World Examples Across Ecommerce, Fintech, Healthcare, and Media
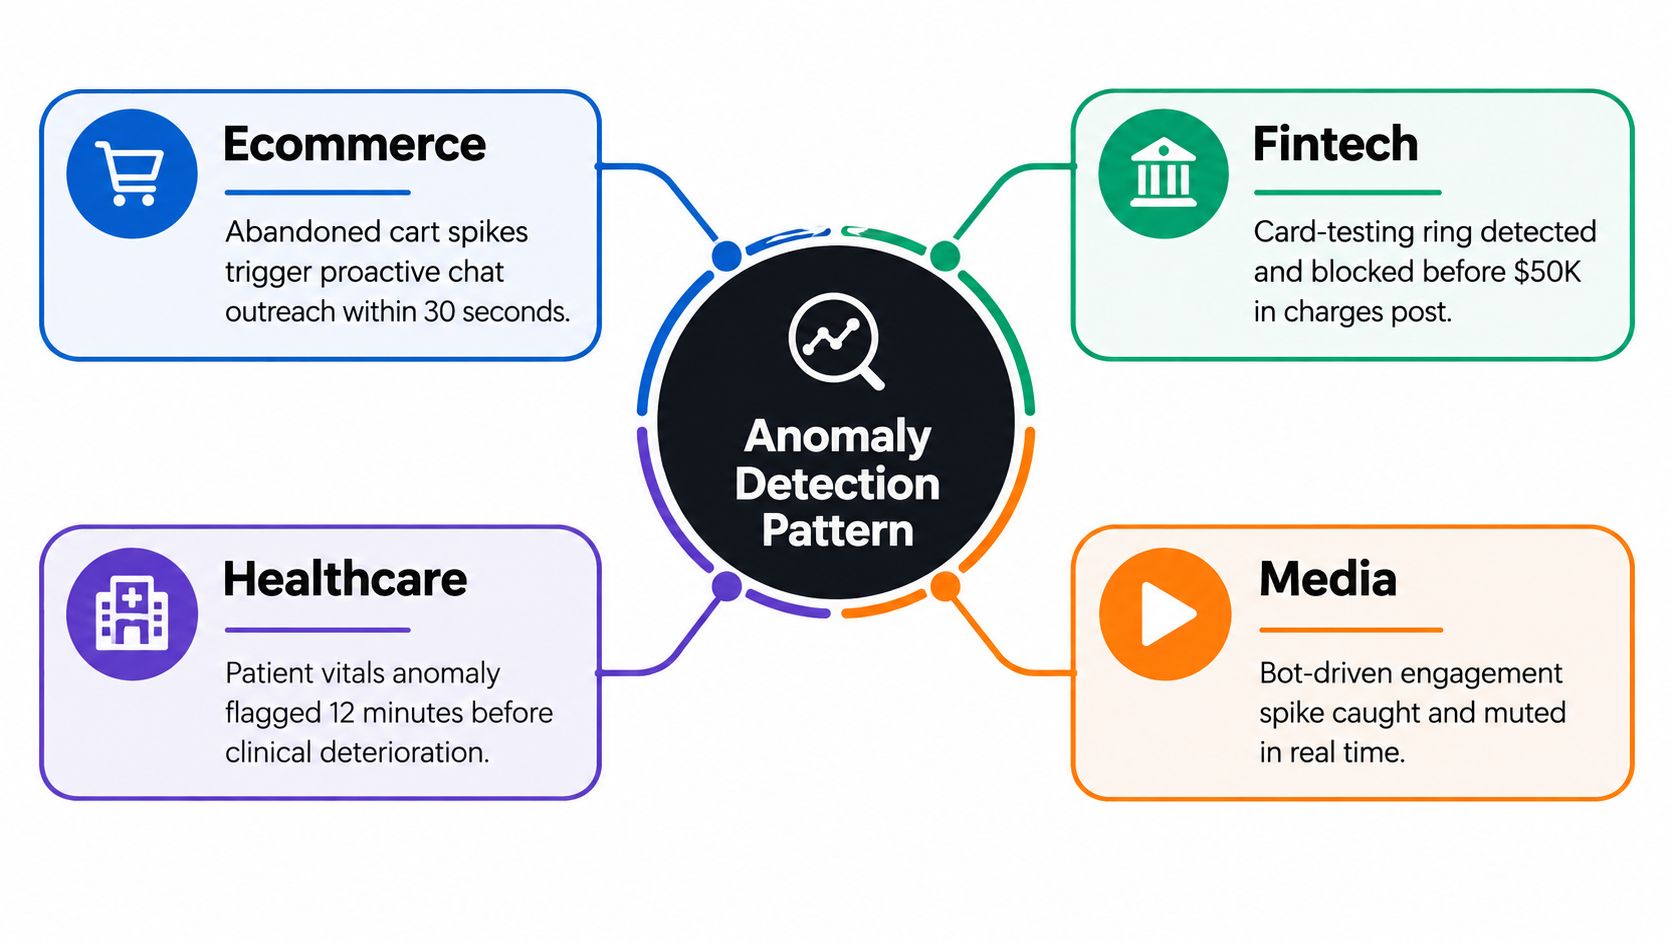
The same pattern, an event deviates from an expected baseline and triggers a response, behaves differently across industries. The right window depends on what can still be changed.
Ecommerce
A checkout stream can reveal an unusual rise in abandoned carts for a product, payment method, browser, or customer segment. A business might respond with proactive chat outreach within 3 seconds, provided the intervention is helpful rather than intrusive. The same stack can detect inventory shrinkage at checkout by comparing expected stock movement with observed scans, returns, cancellations, and fulfillment events.
The hard part isn't detecting every unusual cart. It's distinguishing a genuine friction signal from a campaign, product launch, or normal demand spike.
Fintech
At a payment gateway, card-not-present fraud detection combines transaction context, device signals, merchant history, and velocity. A mule-account detector may focus on unusual transaction relationships and account movement, while a wire-transfer monitor may operate under a 1-second SLA because the transfer can become difficult to reverse.
A score alone isn't enough. The gateway needs a clear action policy, such as approve, step up authentication, hold, or decline, plus a reason code that support and fraud teams can understand.
Healthcare
ICU telemetry illustrates the asymmetric cost of mistakes. Missing a meaningful vitals anomaly can be more serious than creating a false alarm, but excessive alerts can still overwhelm clinical staff. The model therefore needs escalation logic, persistence checks, patient context, and a documented handoff to clinicians.
Claims and billing streams create a different problem. A detector can flag unusual combinations of procedure codes, providers, timing, or patient history for investigation without making an automated clinical judgment.
Media
Media platforms can use anomaly detection to identify viewership spikes that may represent a viral moment and create additional ad-inventory opportunities. Concurrent-stream anomalies can surface CDN problems, while moderation systems can identify sudden bursts of toxic comments within seconds and route them for intervention.
Each example benefits from a different action. A retailer may message a shopper, a bank may pause a transfer, a hospital may escalate a signal, and a media platform may scale delivery or quarantine content. Treating them as one generic alerting problem creates poor user experiences.
A Practical Implementation Playbook
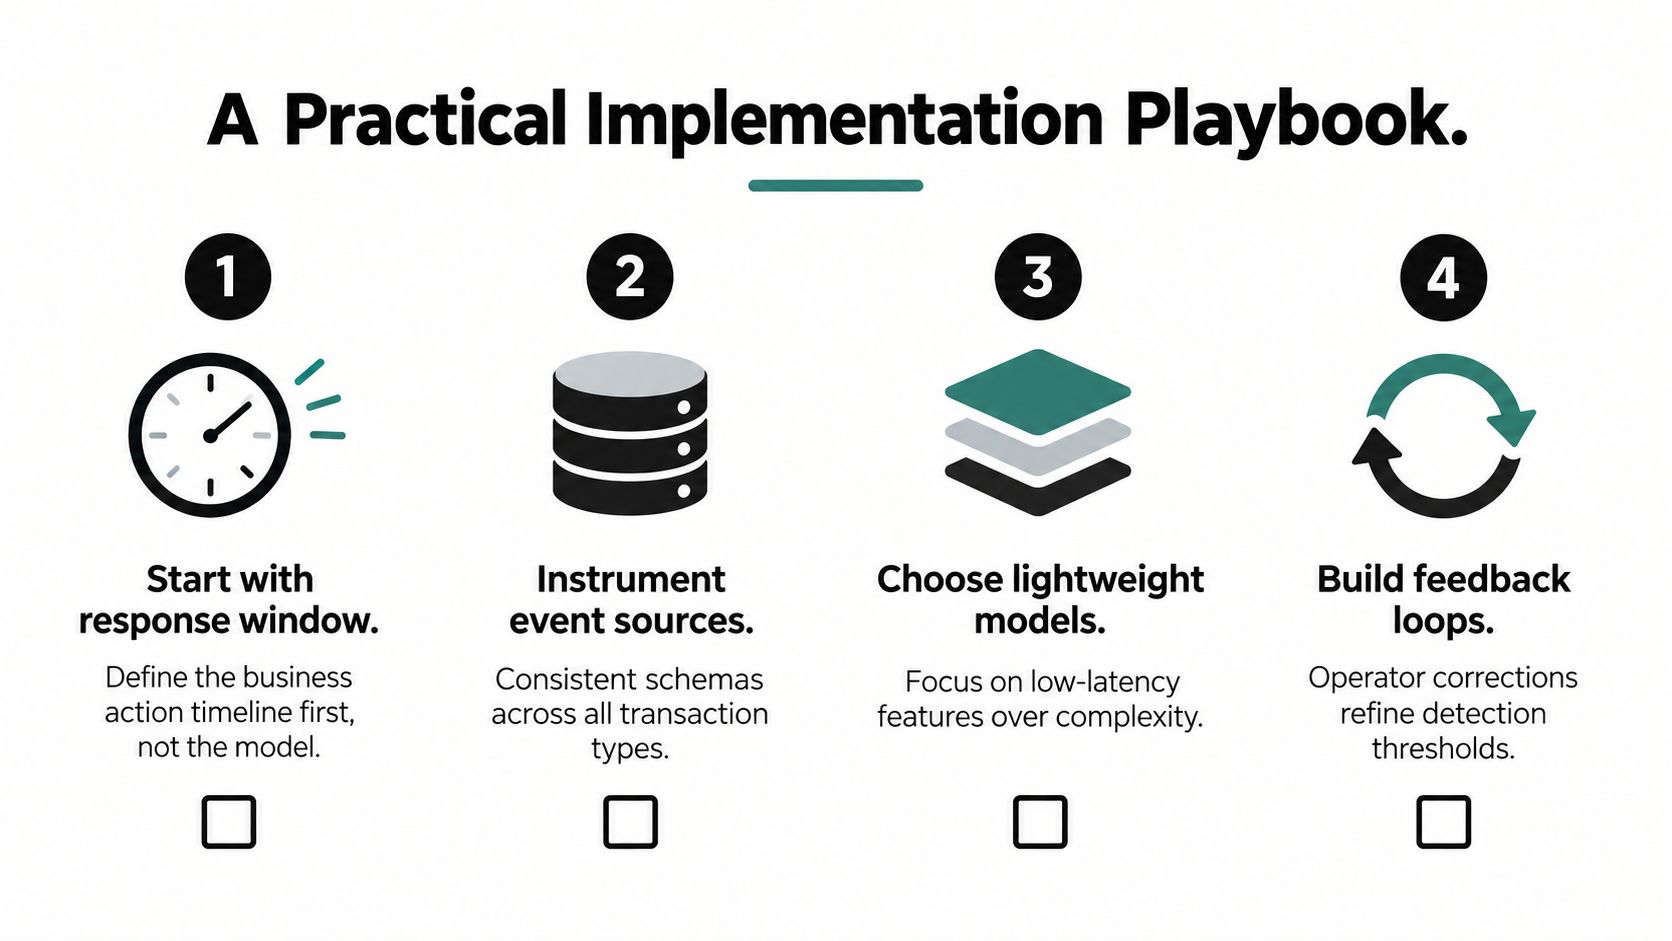
Production teams usually stall at the boundaries between data, operations, and ownership. A disciplined rollout keeps those boundaries visible.
1. Define the response window
Start with the action the business can take. Write down the decision deadline, the fallback if the model times out, and the consequence of a false positive. A fraud block, an investigation queue, and an offline reconciliation job shouldn't share one undifferentiated “real-time” requirement.
2. Instrument event sources
Give transaction types consistent schemas and event-time semantics. Track duplicates, late events, missing fields, and producer lag. Backpressure should be visible before it turns into stale detection.
3. Separate feature types
Streaming aggregates, such as activity over the last 5 minutes, belong in a pipeline that updates continuously. Point-in-time joins should retrieve only historical context available at the moment of scoring. Mixing these paths carelessly creates leakage and makes offline results unreliable.
4. Choose the simplest model that clears the bar
A threshold, EWMA, or seasonal baseline may outperform a complex model operationally because operators can understand and tune it. Add model complexity only when error analysis shows a specific class of misses that the baseline cannot address.
5. Evaluate before exposing traffic
Use labeled windows where labels exist, but don't confuse offline evaluation with production readiness. Shadow mode lets the system score live events without changing decisions. Compare score distributions, feature freshness, latency, alert volume, and operator judgment.
6. Roll out progressively
Put enforcement behind a feature flag. Shift traffic gradually and create guardrails by customer segment, geography, payment method, product category, or device class. A promotion can create concept drift, so the rollout needs a quick rollback path.
7. Capture feedback
Analyst dispositions, customer appeals, overrides, and confirmed incidents should flow back into training data. Cold-start periods and label lag need explicit handling. A model can't learn from feedback that the application never records.
For time-series systems, this practical guide to anomaly detection in time series provides useful context for choosing baselines and evaluating changing patterns. The implementation principle remains simple: measure the operational outcome, not just the model score.
Operationalizing AI With Prompt Management and Cost Control
Anomaly detection increasingly includes an AI layer that investigates signals rather than merely producing them. A language model might summarize a suspicious payment trail, compare an incident with prior cases, extract evidence from tickets, or recommend a review route. That introduces a second production system with its own failure modes.
Prompt changes need version control. A prompt vault can preserve detection instructions, triage formats, and enrichment logic so teams can reproduce a decision and roll back a problematic revision. A parameter manager can control which internal database fields an AI workflow may access, reducing accidental overreach and making the integration easier to review.
Structured logging should capture the model input, output, anomaly score, prompt version, response latency, failure state, and resulting action. This supports drift investigation and audit trails. It also makes it possible to separate a weak detector from a weak summarizer, which otherwise get blamed for the same operator complaint.
Cost control belongs in the design, not in the finance report. Cache routine prompts where safe, use a fast classifier for ordinary cases, and reserve heavier reasoning models for ambiguous or high-impact anomalies. Request budgets and spend alerts keep per-event economics visible as traffic changes.
The prompt management guide from Wonderment Apps offers context for treating prompts as managed application assets rather than disposable strings.
| Control Area | What to Track | Why It Matters |
|---|---|---|
| Prompt versions | Version, owner, change reason, rollback status | Makes AI behavior reproducible |
| Access parameters | Permitted fields, query scope, environment | Limits data exposure |
| Request logging | Inputs, outputs, failures, latency | Supports debugging and audits |
| Cost management | Spend by workflow, model tier, and event class | Prevents uncontrolled inference costs |
| Rollout controls | Shadow traffic, feature flags, segment results | Reduces deployment risk |
| Quality monitoring | Detection coverage, prompt failure rate, operator corrections | Shows whether the AI layer helps |
Useful operational KPIs include detection coverage, prompt failure rate, cost per thousand events, review acceptance, and time from alert to action. Wonderment Apps' prompt management system is one administrative option for versioning prompts, managing internal parameters, logging integrated AI activity, and viewing cumulative spend. The tool fits best when teams need those controls inside an existing application rather than scattered across ad hoc scripts and provider consoles.
Wonderment Apps helps teams modernize web and mobile applications with integrated AI, scalable engineering, observability, and administrative controls for prompts, integrations, and token cost management. Visit Wonderment Apps to explore a demo and discuss how to connect real-time anomaly detection with reliable application workflows.