

Load testing applies a controlled, expected workload to a system to see whether it can sustain normal and peak demand while meeting latency, throughput, and stability objectives. In practice, teams judge it with concrete signals like p50, p95, and p99 response times, error rates, throughput, and saturation rather than a simple “it felt fine” verdict.
Launch week tends to create the same movie in a lot of companies. Marketing flips the switch, traffic climbs, the homepage still loads for users, and someone in a Slack channel says the dashboard looks green. Meanwhile a customer is staring at a checkout spinner, a sales rep can't finish a quote, or an AI-powered feature suddenly takes too long to answer.
That gap is why “what is load testing” is such an important question. It isn't just checking whether an app works. It's checking whether it keeps working when real people arrive together, click around in messy patterns, and expect the whole thing to feel fast.
For teams modernizing products with AI, the stakes get even higher. An application might be fine when one person triggers a prompt, but wobble when many users hit the same retrieval flow, logging layer, or model integration at once. That's one reason administrative systems for AI operations matter too. A prompt management setup with versioned prompts, parameter controls for internal database access, cross-AI logging, and cost visibility gives teams a cleaner foundation before they test how the app behaves under pressure.
Introduction to What Load Testing Really Means
A launch can look healthy from 30 feet away and still be failing where the business makes money.
Traffic rises after a campaign. Cached product pages still open quickly for homepage visitors, while checkout requests start timing out for users who are signed in, applying discounts, and trying to pay at the same time. The status page stays green. Revenue does not.

The plain English definition
Load testing checks whether your system can handle the amount of work you expect it to handle, under controlled conditions, without getting slow, error-prone, or unstable.
The key phrase is expected amount of work. You are modeling real demand, not trying to smash the app until it breaks. A good test uses the journeys that matter to the business, such as sign-in, search, checkout, dashboard queries, file uploads, or calls to an AI feature. Then the team measures what happens across response time, throughput, request volume, and error rate. Tools such as Azure Load Testing test run results make those patterns visible during and after a run.
One useful way to frame it is simple. Load testing asks, “Can this product do its normal job when lots of real users show up together?”
Why the meaning of load testing has changed
Many teams still treat load testing like a fire drill before launch. Run one big test, save the screenshot, and move on.
That approach misses how modern systems fail.
Cloud apps scale up and down automatically. Code ships through CI/CD pipelines every day, not every quarter. AI-powered features add slower dependencies, bursty traffic, and new cost tradeoffs. In that setup, load testing works better as an ongoing scaling discipline. It helps teams check whether autoscaling rules trigger soon enough, whether a new release made a key workflow slower, and whether an AI-backed path still feels fast when several users hit the same retrieval or inference flow together.
A useful mental model is a restaurant kitchen. Serving ten tables at lunch proves very little about a Friday night rush. The question is whether the kitchen, staff, and supply line keep pace as orders overlap, menu items vary, and timing gets messy. Software behaves the same way.
The confusion point that trips up teams
Performance testing is an umbrella term. Load testing is one tool under that umbrella.
Teams often blur together four different questions:
- Load test: Can the system handle expected traffic levels while meeting service goals?
- Stress test: What happens after demand pushes past safe capacity?
- Spike test: What happens if traffic jumps fast instead of rising gradually?
- Soak test: What breaks after sustained traffic over a longer period?
That distinction matters because each test answers a different business risk. If you are planning a product launch, a load test checks whether normal and forecasted demand will hold. If you depend on autoscaling, a spike test shows whether the platform catches sudden bursts quickly enough. If you run long billing jobs, overnight imports, or always-on AI workflows, a soak test exposes slow leaks, queue buildup, and resource exhaustion that a short run will miss. If you need to know the failure point and recovery behavior, use a stress test.
What business leaders should take from this
Load testing is not a one-time gate before you go live. It is repeated evidence about how your product behaves as traffic, code, infrastructure, and AI features change.
That makes it useful well beyond engineering. Product leaders can use it to judge launch readiness. Operations teams can tune autoscaling and capacity plans. Engineering teams can add it to CI/CD so regressions show up before customers do. And everyone gets a clearer answer to the only question users care about: does the product stay fast and reliable when they need it?
How Load Testing Works
Load testing works like a controlled traffic drill for your application. The goal is simple. Recreate the kind of overlap your product sees in normal use, then watch what changes as more people try to do work at the same time.
One person opening a dashboard rarely tells you much. Fifty people logging in, searching, refreshing data, and saving changes within the same minute can expose a very different system. Shared resources start competing for attention. Database connections get busy. Queues lengthen. CPU and memory usage rise. Autoscaling may help, or it may respond too slowly to matter.
Why Concurrency Matters Most
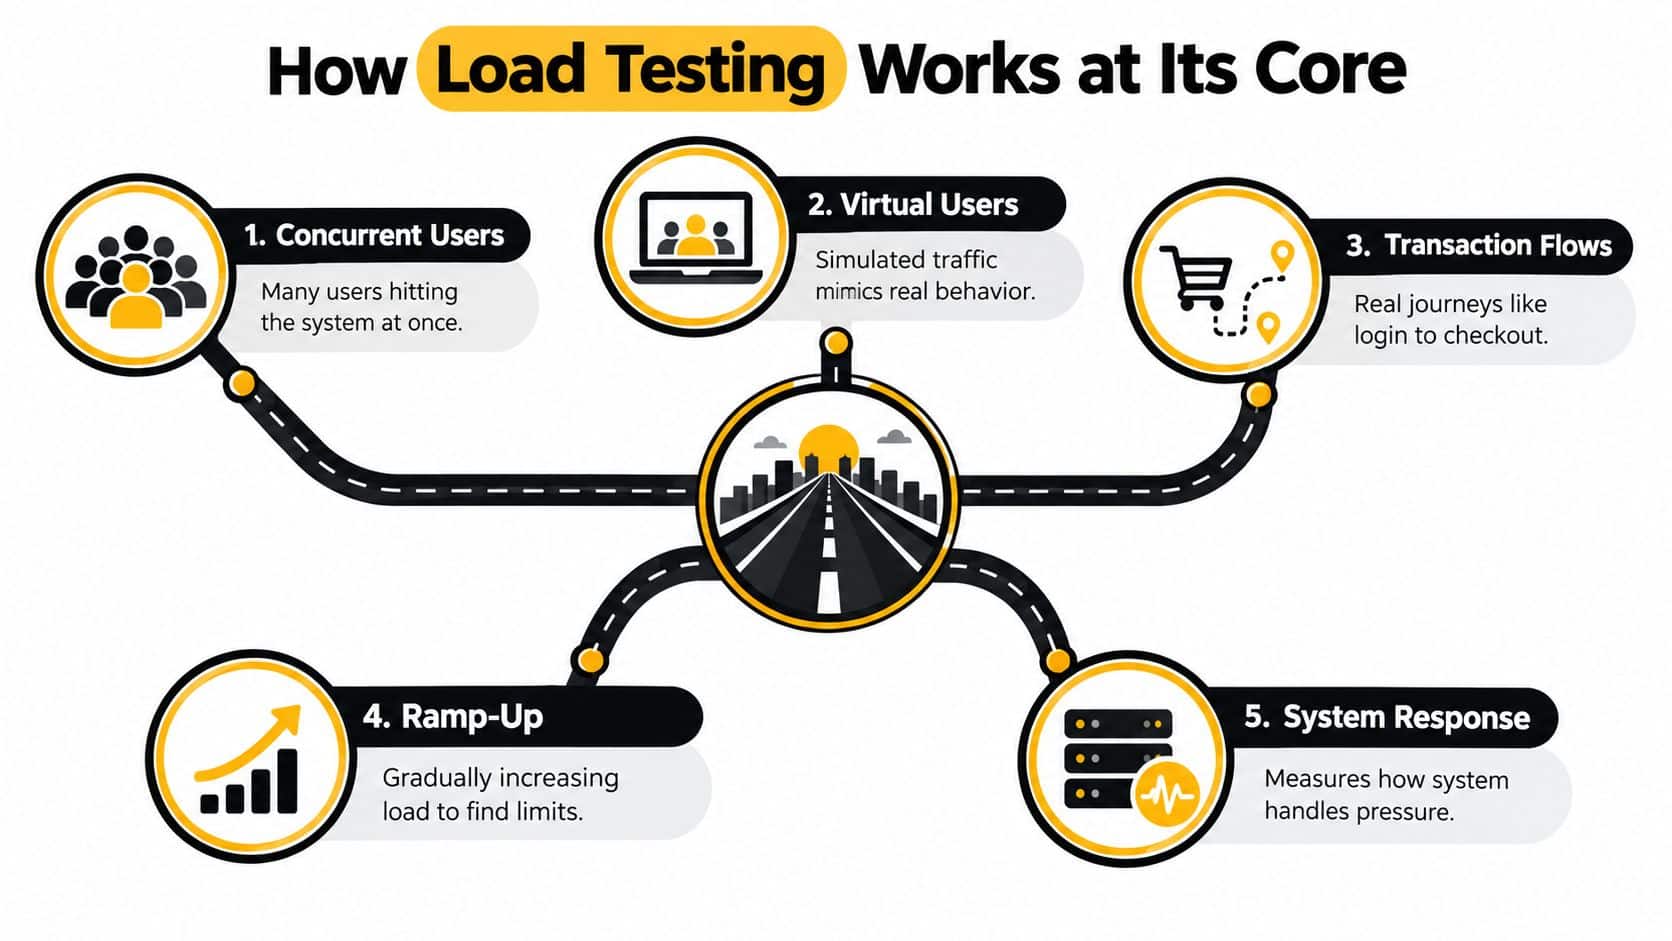
The center of load testing is concurrency. That means how many users or processes are active at once, not how one isolated request performs on a quiet system.
Tools often report signals such as thread count, total executions, transactions per second, bytes per second, failed-request ratios, and average, minimum, maximum, and last response times for steps within a run, as shown in the SoapUI load test window reference. Those numbers help, but the main question is practical: what happens when real usage overlaps?
That is where many teams get surprised. A page can look fast in development and still struggle in production because the bottleneck is not the page itself. It is the pileup behind it. A checkout flow may wait on inventory checks. An AI-assisted workflow may pause while model calls stack up. A reporting screen may stay quick until too many people ask for fresh data at once.
What the test is actually doing
A load test usually follows a repeatable pattern:
- Choose the user flows that matter. Examples include login, search, checkout, dashboard refresh, file upload, or an AI-assisted support workflow.
- Model those flows with virtual users. The tool simulates people moving through the product, often with pauses and different paths instead of one identical click sequence.
- Raise traffic to an expected level. Sometimes the load rises gradually. Sometimes it holds steady to match a business event or a known usage window.
- Track system behavior while the load runs. Teams watch response times, throughput, failures, resource usage, queue depth, and scaling activity.
- Identify where experience starts to slip. That point matters more than a simple pass or fail label.
The useful output is not “the app survived.” It is a clearer map of capacity. You learn which journey slows first, what component creates the backup, and whether the system still meets service goals at the traffic level you expect. That is what turns load testing from a launch exercise into an operating habit for teams shipping changes every week.
Ramp-up changes what you learn
Load rarely arrives all at once in a standard load test. It usually builds over time.
Ramp-up is the period during which virtual users are added until the test reaches its target level. If a test reaches 20 users over 120 seconds, each user starts at a spaced interval rather than all together. Grafana k6 explains ramping-vus as stages that increase or decrease the number of active virtual users over time.
That detail matters because the shape of the traffic changes the diagnosis. If the app slows during the climb, you may be seeing connection limits, cold caches, startup overhead, or slow scale-out behavior. If it handles the climb and only degrades later, the issue may be sustained pressure on a dependency, memory growth, or background work that accumulates.
Why this matters more in modern systems
Load testing used to be treated as a pre-launch checkpoint. That model breaks down once your product changes constantly.
Teams now ship through CI/CD, rely on autoscaling, and add features that call external APIs or AI services with less predictable latency. In that setup, load testing works best as an ongoing scaling discipline. A useful test suite checks whether a new release changed latency under expected load, whether autoscaling still reacts fast enough, and whether a new AI-powered flow creates queueing or cost pressure under concurrency.
That is also why good load tests are tied to decision-making. Use them to validate expected demand, tune scaling rules, compare releases, and catch regressions before customers feel them. The method is straightforward. The discipline is keeping it current as your traffic, code, infrastructure, and product shape keep changing.
Load Testing Versus Stress Spike and Soak Testing
The most common performance mistake isn't skipping testing. It's running the wrong test and walking away with false confidence.
A load test asks, “Can this system handle the demand we expect?” A different test asks, “What happens when we go past that?” Another asks, “What if traffic arrives all at once?” Another asks, “What breaks after running for a long time?” These are not the same question.
Choosing the right test for your risk
| Test Type | Goal | Load Pattern | Key Signal |
|---|---|---|---|
| Load testing | Validate expected normal and peak demand | Controlled workload shaped like real usage | Where latency, throughput, or stability starts to degrade under expected load |
| Stress testing | Find the breaking point | Push beyond expected demand | Failure mode, recovery behavior, and capacity ceiling |
| Spike testing | Check sudden surges | Rapid jump in traffic | How quickly the system absorbs abrupt demand changes |
| Soak testing | Check endurance over time | Sustained load over a longer run | Slow leaks, resource creep, and stability drift |
When each one makes sense
A retailer preparing for a seasonal promotion usually starts with load testing because expected demand is the immediate business risk.
A fintech team worried about a sharp payday or billing event may also run a spike test because the shape of the traffic matters as much as the total volume.
A SaaS platform that runs long-lived sessions, background jobs, or AI workers often needs soak testing to catch issues that don't appear in a short run. Memory leaks and connection exhaustion love patience.
A team that wants to know where the app fails and how it recovers after failure needs stress testing.
The decision shortcut
Use this simple filter:
- Choose load testing when you need confidence in expected production demand.
- Choose stress testing when you need to know the failure boundary.
- Choose spike testing when traffic can jump suddenly.
- Choose soak testing when long-duration stability is the concern.
If your team treats all four as interchangeable, you'll miss the point of each one. That's why broader non-functional testing practices at Wonderment Apps are useful to think about as a portfolio, not a single checkbox.
A passing test only means something if it matched the risk you were actually trying to reduce.
Key Metrics That Reveal Real User Experience
Many dashboards get misleading.
Averages are tidy. Users are not. One person gets a fast response, another waits much longer, and the mean politely hides the argument.
Start with percentile latency
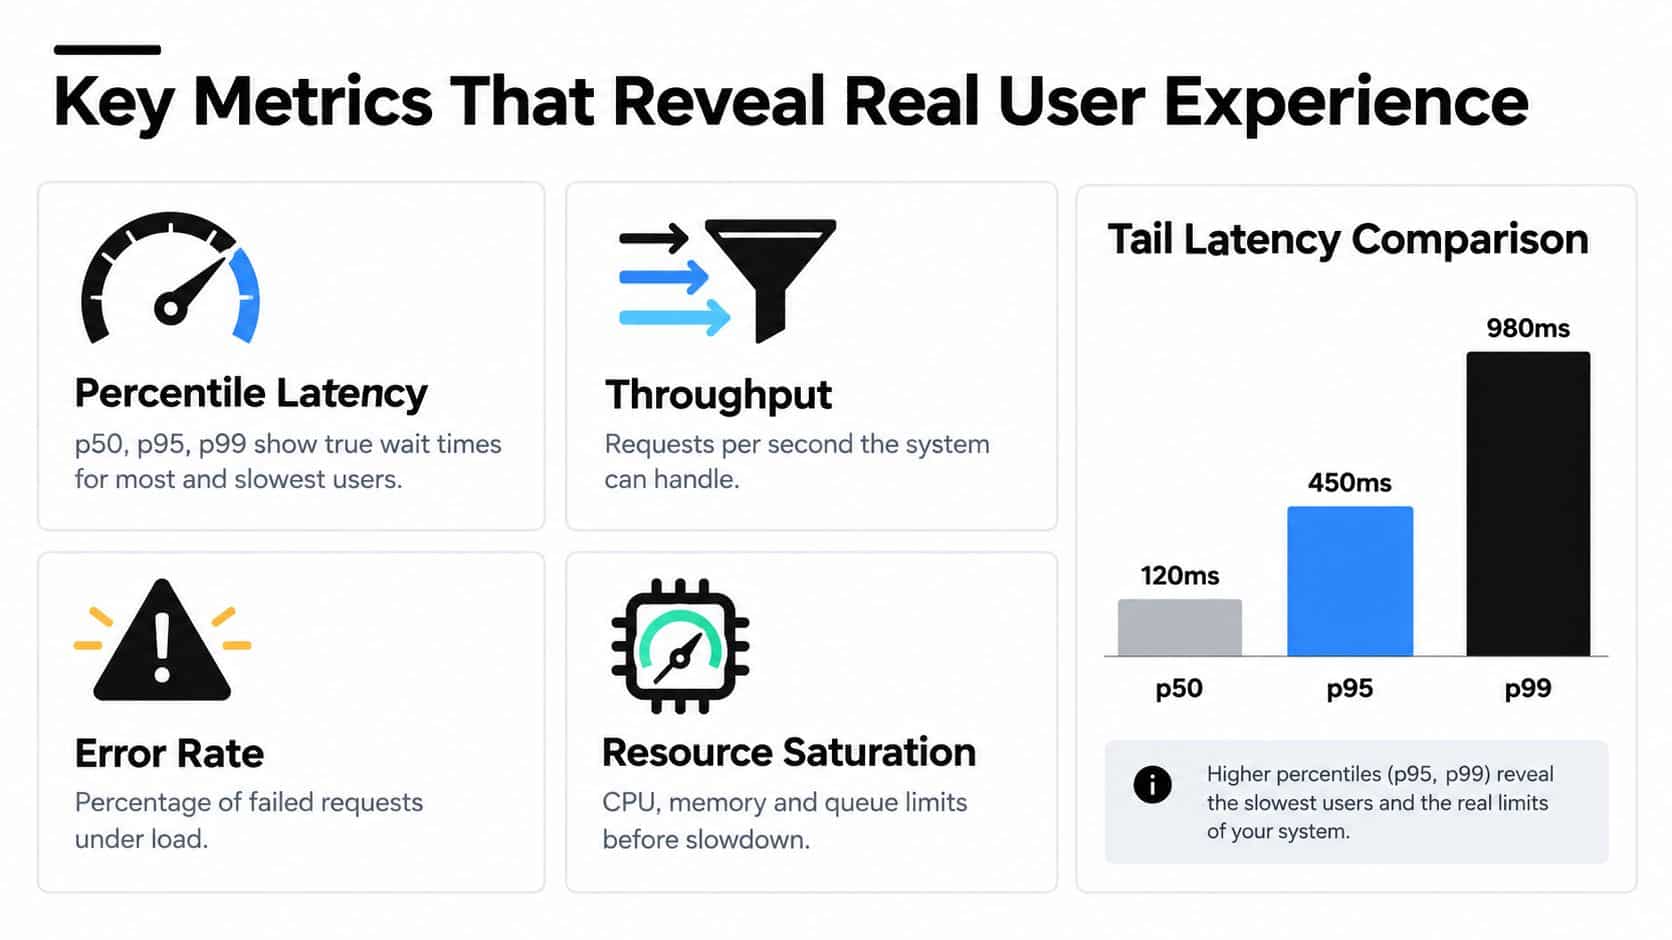
In load testing, experts recommend tracking p50, p95, and p99 response times because averages can hide tail-latency spikes and overload conditions that users feel, especially when systems begin saturating in CPU, memory, disk I/O, or connection pools, as explained in load test metrics beyond response time.
Here's the plain meaning:
- p50 means half of requests finished at or below that time.
- p95 means 95% of requests finished at or below that time, and the slowest 5% took longer.
- p99 means 99% of requests finished at or below that time, leaving the slowest 1% in the tail.
That percentile interpretation is the core mechanic behind acceptance criteria and SLOs in Loadster's response time percentile FAQ.
Add throughput and error rate
Latency tells you how long users wait. Throughput tells you how much work the system is processing. Error rate tells you how often the system gives up.
If you want a practical way to connect test findings to operations, this guide on how to measure throughput in production is useful because it bridges synthetic testing and live system observation.
A healthy-looking average can coexist with trouble. One classic warning sign is this combination:
| Metric pattern | What it often suggests |
|---|---|
| Throughput rises and latency stays steady | The system is scaling reasonably |
| Throughput flattens while p95 and p99 rise | A bottleneck is forming |
| Error rate climbs with tail latency | The system is saturating or timing out |
| Resource usage peaks while user paths slow | Capacity or configuration limits need tuning |
Turn metrics into pass or fail rules
Percentiles become much more useful when you make them machine-checkable. Load-testing tools often let you define thresholds directly. In k6-style syntax, a rule such as p(95)<500 means the test fails if the 95th-percentile response time exceeds 500 ms, as described in LoadFocus guidance on pass fail thresholds.
Some teams also map targets to business context. One published reference suggests typical acceptable response times of under 500 ms for internet services, under 1 second for financial services, under 3 seconds for insurance, and under 5 seconds for manufacturing, while also recommending percentile metrics such as p50, p90, p95, and p99 alongside averages in Loadmill's guide to analyzing load test results.
Watch for this pattern: When throughput stops climbing but p95, p99, and timeout rates worsen, the problem is often saturation, not traffic volume alone.
Don't read the dashboard in isolation
A latency graph without context can send teams chasing the wrong fix. If p95 rises only on login, check auth dependencies. If throughput stalls during search, inspect indexes, caching, and query shape. If AI responses slow while the rest of the app remains stable, the issue may sit in model orchestration, prompt flow, or a downstream retrieval step.
That's why good teams combine test metrics with operational visibility, including performance monitoring tools for application behavior over time. Load testing tells you when the system bends. Monitoring helps you see where.
Typical Workflow Tools and Real World Examples
A useful load test starts with a business moment, not a traffic number.
Your team is preparing for a promotion, a billing run, or a new AI feature rollout. The question is not how many virtual users you can generate. The question is which user behavior could expose a weak point first. A checkout path, a login burst, a retrieval step inside an AI workflow, and a nightly sync job all strain different parts of the system.
A realistic workflow from plan to insight
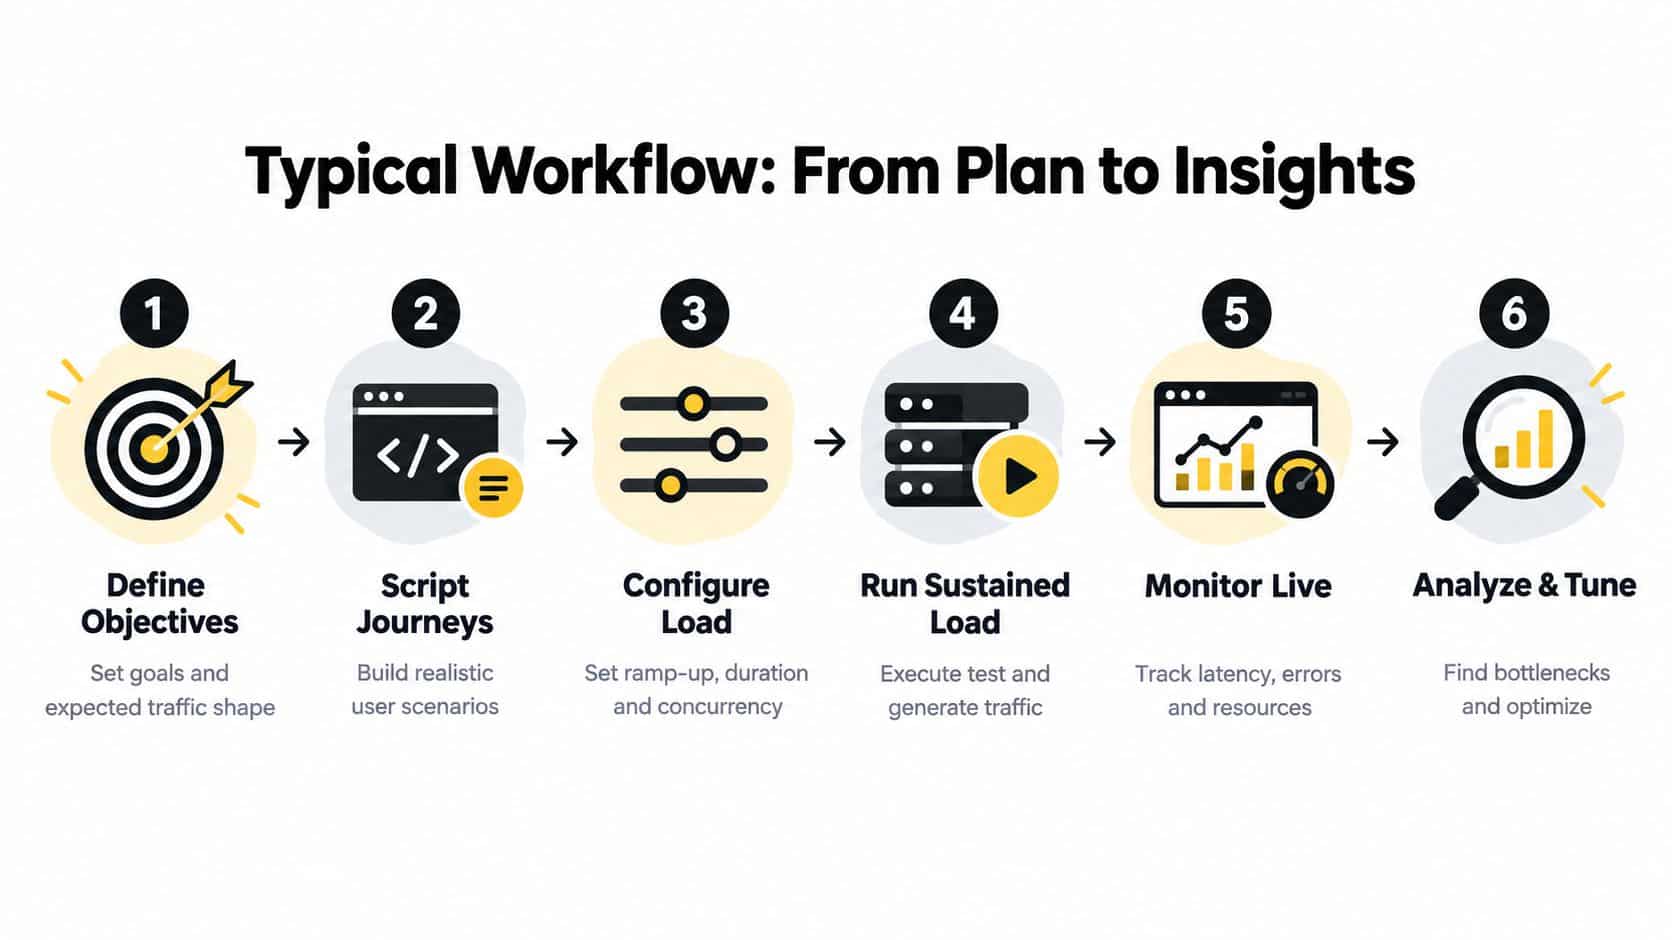
Teams running continuous load tests typically follow this six-step pattern:
- Name the decision you need to make. Examples include whether checkout can handle a campaign, whether autoscaling kicks in early enough, or whether an AI assistant stays responsive when many users submit prompts at once.
- Choose the right test type for that decision. Use load tests for expected demand, stress tests to find breaking points, spike tests for sudden surges, and soak tests for slow failures that appear only after hours.
- Model real user journeys. Script the flows people take, including pauses, logins, searches, cart updates, background API calls, and any downstream services involved.
- Shape the traffic. Set the ramp-up, target concurrency, and duration so the test mirrors a realistic day rather than a synthetic sprint.
- Run the test while watching system behavior. Check application metrics alongside infrastructure signals such as CPU, memory, queue depth, database connections, and scaling events.
- Review the result against prior runs. Compare releases, find regressions, and turn the findings into changes for code, caching, queries, timeouts, or scaling rules.
That workflow matters because load testing now sits inside an ongoing delivery rhythm. The useful output is not a one-time pass. It is a record of how the system behaves as the product, infrastructure, and traffic mix keep changing.
Ramp-up is easier to understand with one concrete example
Suppose you want to reach 20 virtual users over two minutes. You would not start all 20 at once. You would add them gradually, a few seconds apart, so the team can watch the application during the climb and not only at peak traffic.
That sounds simple, but it changes what you learn. A sudden start is better for a spike test. A gradual increase is better when you want to see whether connection pools, caches, autoscaling rules, or third-party dependencies begin struggling before the top of the curve.
Tool categories that matter more than brand names
The best tool is the one that matches your delivery model and the kind of system you run.
A product team shipping weekly may want code-driven tests that fit naturally into CI/CD. A QA-heavy team may prefer a visual tool that makes complex journeys easier to build and review. A platform team supporting AI features may care most about scripting multi-step API orchestration, variable response times, and downstream bottlenecks.
Whatever the interface looks like, good tools usually support the same jobs:
- Realistic scripting for browser flows, APIs, background jobs, and multi-step user journeys
- Traffic shaping for gradual ramps, fixed concurrency, bursts, and long holds
- Thresholds and automation so builds can fail when response time or error limits are crossed
- Run history and comparison views so teams can spot regressions over time
- Result export and sharing so engineering, product, and operations can review the same evidence
Real-world examples that make this practical
An ecommerce team might test product search, cart updates, and checkout in one scenario because each journey hits different services. Search may stress indexes and caching. Checkout may expose payment latency or inventory locks.
A fintech platform may focus on billing cycles, balance refreshes, payment status updates, and account dashboards. Those flows often reveal whether queue settings, retry logic, and database connection limits match real production behavior.
A media app preparing for a live event may care less about average traffic and more about a sharp login burst followed by entitlement checks and content requests. That is a case where load testing alone is not enough. The team may run a load test for steady event traffic, then a spike test for the moment the stream opens.
AI features add another layer. A support assistant can look healthy in a single-user demo and still slow down badly when many people submit prompts at once. The bottleneck may sit in retrieval, model routing, guardrail checks, or response streaming rather than in the main web app itself.
The best load test script looks like a day in the life of your users, plus the ugly moments when many of them show up at once.
There is a common trap here. Teams can get a clean report from a test that uses static data, unrealistic pacing, or an environment that behaves nothing like production. That kind of pass result gives false confidence and can lead to the wrong fix, as discussed in RadView's take on modern application load testing.
Scaling Strategies and CI/CD Integration That Last
The biggest mindset shift is this. Load testing shouldn't live only in the week before launch.
If you treat it as a release gate and nothing more, you'll catch some obvious issues but miss the slow regressions that arrive with later releases, dependency changes, schema updates, and new AI features.
What continuous practice looks like
A durable approach folds load testing into delivery workflows. Teams run smaller checks during regular release cycles, compare trends over time, and reserve larger exercises for high-risk events such as launches, seasonal traffic, or architecture changes.
That turns results into operating decisions:
- Autoscaling thresholds become grounded in measured behavior
- Database connection limits can be tuned before peak traffic
- Queue sizes and timeouts can reflect actual contention patterns
- Caching strategy can be validated against real request flows
- AI-backed features can be checked under concurrent use, not just single-user demos
For teams building this muscle, continuous performance testing practices are the bridge between one-off testing and repeatable engineering discipline.
Realism matters more than bravado
A lot of teams ask the wrong question first. They ask how many virtual users they should test with.
A better question is whether the test reflects production reality. Does the environment resemble production? Do the scripts capture real traffic shape? Does the data model account for caching behavior, queueing, and dependency limits? If not, high virtual-user counts can create theater instead of insight.
This becomes even more important when AI enters the system. An AI-modernized app can involve prompt routing, database-backed retrieval, logs across multiple model providers, and cost controls that change runtime behavior. Those pieces need operational discipline, not just clever prompts.
One practical tooling example
One option teams use in this area is Wonderment Apps' prompt management system, which is an administrative tool that plugs into existing software to support AI modernization. It includes a prompt vault with versioning, a parameter manager for internal database access, a logging system across integrated AI tools, and a cost manager for cumulative spend visibility. In load-testing terms, that kind of structure helps teams test AI-driven behavior with clearer observability and change control.
The larger point is simpler than the tooling. If your application must scale for web, mobile, and AI-powered experiences, performance needs to be something your team rehearses continuously, not something you hope still works from last quarter's launch prep.
Conclusion and Practical Next Steps for Your Team
Load testing is the disciplined way to answer a very practical question. Can this system handle the demand we expect without making users wait, fail, or give up?
The best teams don't use it as a ceremonial pre-launch hurdle. They use it to make capacity planning evidence-based, tune systems before users feel pain, and keep finding regressions as the product evolves.
Here's a simple checklist to put into practice:
- Model real traffic shape. Use journeys that resemble how customers behave.
- Set percentile-based goals. Don't rely on averages when tail latency tells the story.
- Include throughput and error signals. Speed without capacity, or capacity with failures, still hurts the business.
- Automate where possible. Put repeatable checks into CI/CD so performance doesn't drift.
- Review trends, not just one run. Histories and comparisons catch regressions that a single green test won't.
- Protect realism. Non-production environments, static data, and artificial scripts can create dangerous confidence.
One final caution. A successful test result isn't always a truthful one. If the workload was unrealistic, the data was stale, or the environment was softer than production, that green check can become expensive fiction.
The good news is that none of this requires magic. It requires clarity, consistent measurement, and the discipline to treat performance as part of product quality. If your team is asking what load testing is, the better next question is this: what production risk are we trying to learn about, and how often are we learning from it?
If you're modernizing an app with AI and need the operational side to be manageable, Wonderment Apps offers product engineering, scaling support, and an AI prompt management toolkit built for real applications. If you want to see how that fits with continuous load testing, observability, and long-term modernization, visit Wonderment Apps.