

A fraud alert lands on your support team's dashboard just after a mobile app update. Transaction volume has climbed, but the suspicious activity is harder to separate from normal customer behavior. A few users are locked out, genuine purchases are delayed, and the business is now balancing two risks, letting fraud through or treating loyal customers like criminals.
That's the practical challenge behind anomaly detection models. A model must identify unusual behavior quickly, explain why it raised an alert, and operate reliably across mobile apps, desktop software, APIs, databases, and cloud infrastructure. The algorithm matters, but so does the administrative layer around it. Wonderment Apps' prompt management system can plug into an existing AI application with a prompt vault and versioning, a parameter manager for internal database access, logging across integrated AI services, and a cost manager for cumulative spend. Those controls help development and operations teams manage the prompts, data access, observability, and cost attached to an AI-powered detection pipeline.
Introduction to Anomaly Detection Models
A production anomaly rarely arrives with a polite label saying “this is the problem.” It may appear as a sudden burst of purchases from one account, a database query pattern that doesn't match normal usage, or a sequence of small service delays that eventually becomes an outage. Users experience the consequence first, often as a failed payment, a slow screen, or an unexplained security check.
Anomaly detection models turn those scattered signals into a decision-support workflow. They score activity, compare it with an expected baseline, and help a person or automated system decide what deserves attention. In a consumer mobile app, that might mean routing a suspicious transaction to review. In desktop software, it could mean flagging unusual file access or a sudden change in resource consumption.
The most effective implementation combines model selection with operational controls. A detector that performs well in a notebook can still create trouble if engineers can't reproduce its prompt instructions, analysts can't inspect its logs, or finance teams can't see how frequent AI inference affects spending.
Wonderment Apps' administrative toolkit addresses that surrounding layer. Developers can maintain reusable prompts in a versioned vault, manage parameters used for controlled database access, review activity across integrated AI services, and use the cost manager to track cumulative spend. The system can sit alongside a custom detection pipeline rather than requiring a complete rebuild, giving teams a practical way to organize AI-assisted explanations, investigation workflows, and application administration.
Practical rule: Treat anomaly detection as a product capability, not just a model endpoint. Customers, operators, developers, and finance teams all depend on its behavior.
The stakes rise as applications scale. More users create more normal variation, while fraud, abuse, outages, and quality failures remain comparatively rare. A scalable system therefore needs a detection strategy that fits the data, plus monitoring and governance that keep the strategy dependable after launch.
Understanding Key Concepts
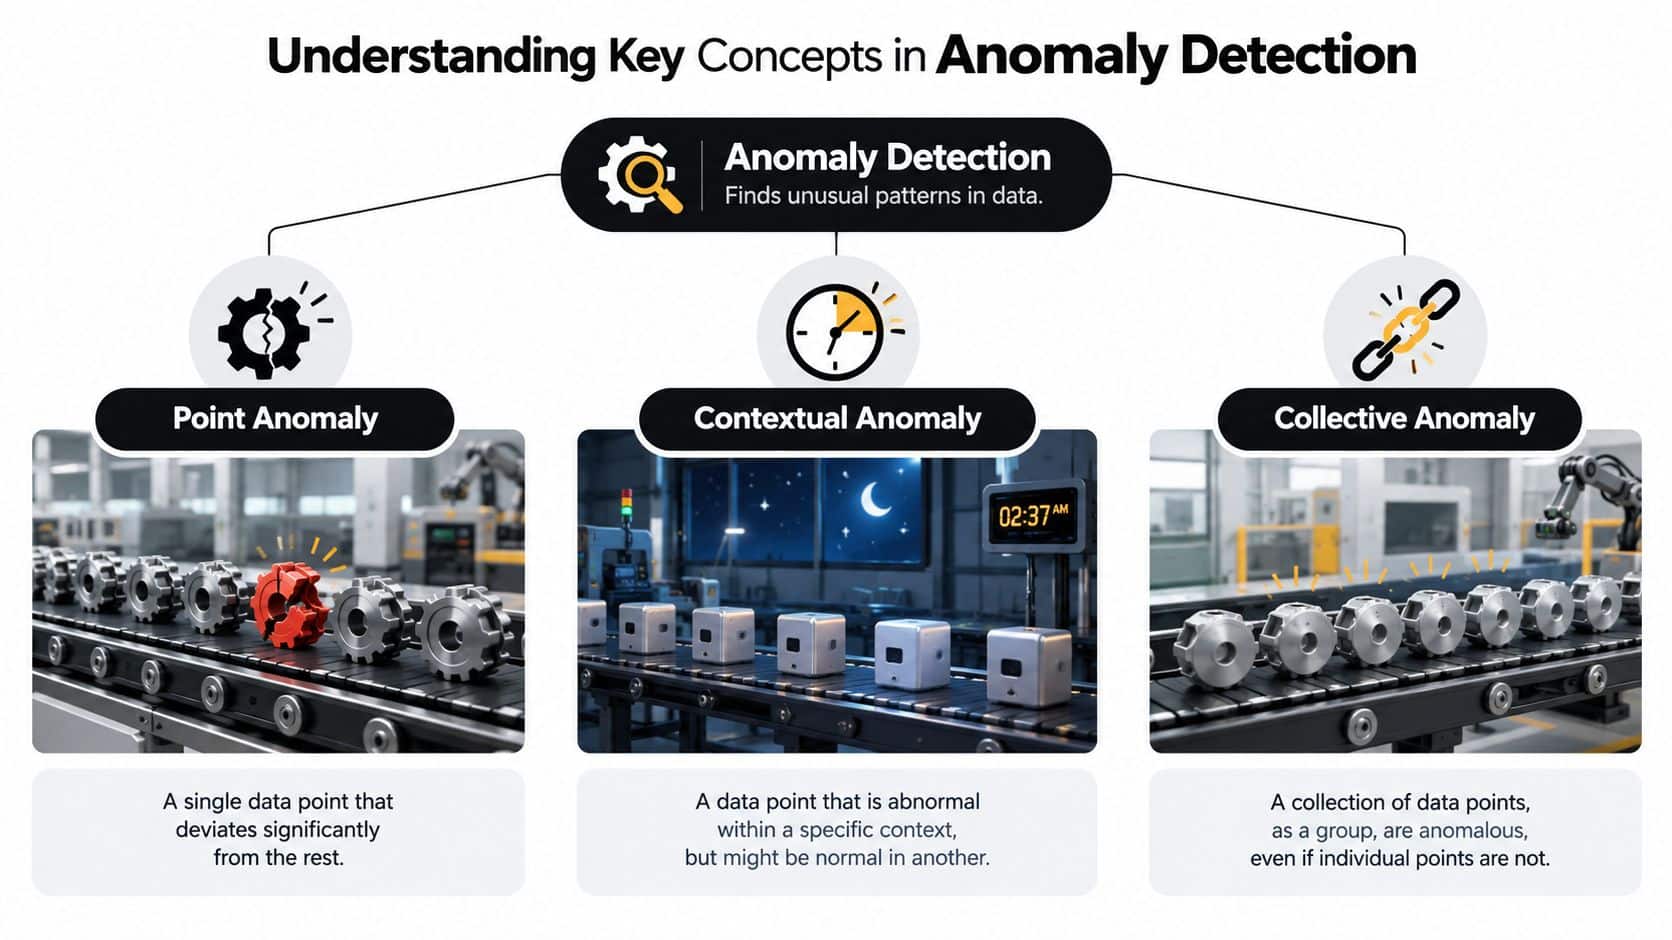
A useful way to understand anomaly types is to watch a factory assembly line. Most products move through the line in a predictable way, but “unusual” can mean several different things depending on what you're observing.
A point anomaly is one defective item among otherwise consistent products. One widget has a broken gear, while the items before and after it look normal. In data, a single transaction, sensor reading, login, or image differs sharply from the surrounding observations.
A contextual anomaly looks normal in isolation but strange within its setting. A product made at night may be perfectly acceptable during a scheduled overnight shift, yet suspicious if that factory normally produces it only during the day. The same value can therefore be normal in one context and anomalous in another. Time, location, user identity, device type, season, and operating mode can all change the interpretation.
A collective anomaly, also called a sequence-level anomaly, involves several events that become suspicious together. Each product might have a small dent that wouldn't trigger inspection alone, but a run of slightly damaged products suggests a machine problem. The equivalent data pattern could be a chain of modest latency increases, repeated password attempts, or several related purchases that form a suspicious sequence.
Why the history still matters
Anomaly detection didn't begin with neural networks. Its roots reach back to 1777, when early statistical thinking was already addressing whether extreme observations should be accepted or rejected. Time-series work later gave the field a more structured foundation, including Page's study in 1957, Fox's classification of two anomaly types in 1972, and Tsay's expansion to four categories for univariate time series in 1988. These milestones are summarized in the historical review of time-series anomaly detection.
That progression matters because model design starts with a definition of abnormality. A point detector may work well for an isolated outlier but miss a sequence pattern. A contextual detector needs the right context features, while a visual inspection system may need spatial information that a tabular model can't represent.
Before choosing an algorithm, write down what constitutes an anomaly in your application. Ask whether the issue is a single observation, a value that depends on context, or a pattern spread across time. This simple distinction prevents teams from using an advanced model to solve the wrong problem.
Exploring Anomaly Detection Techniques
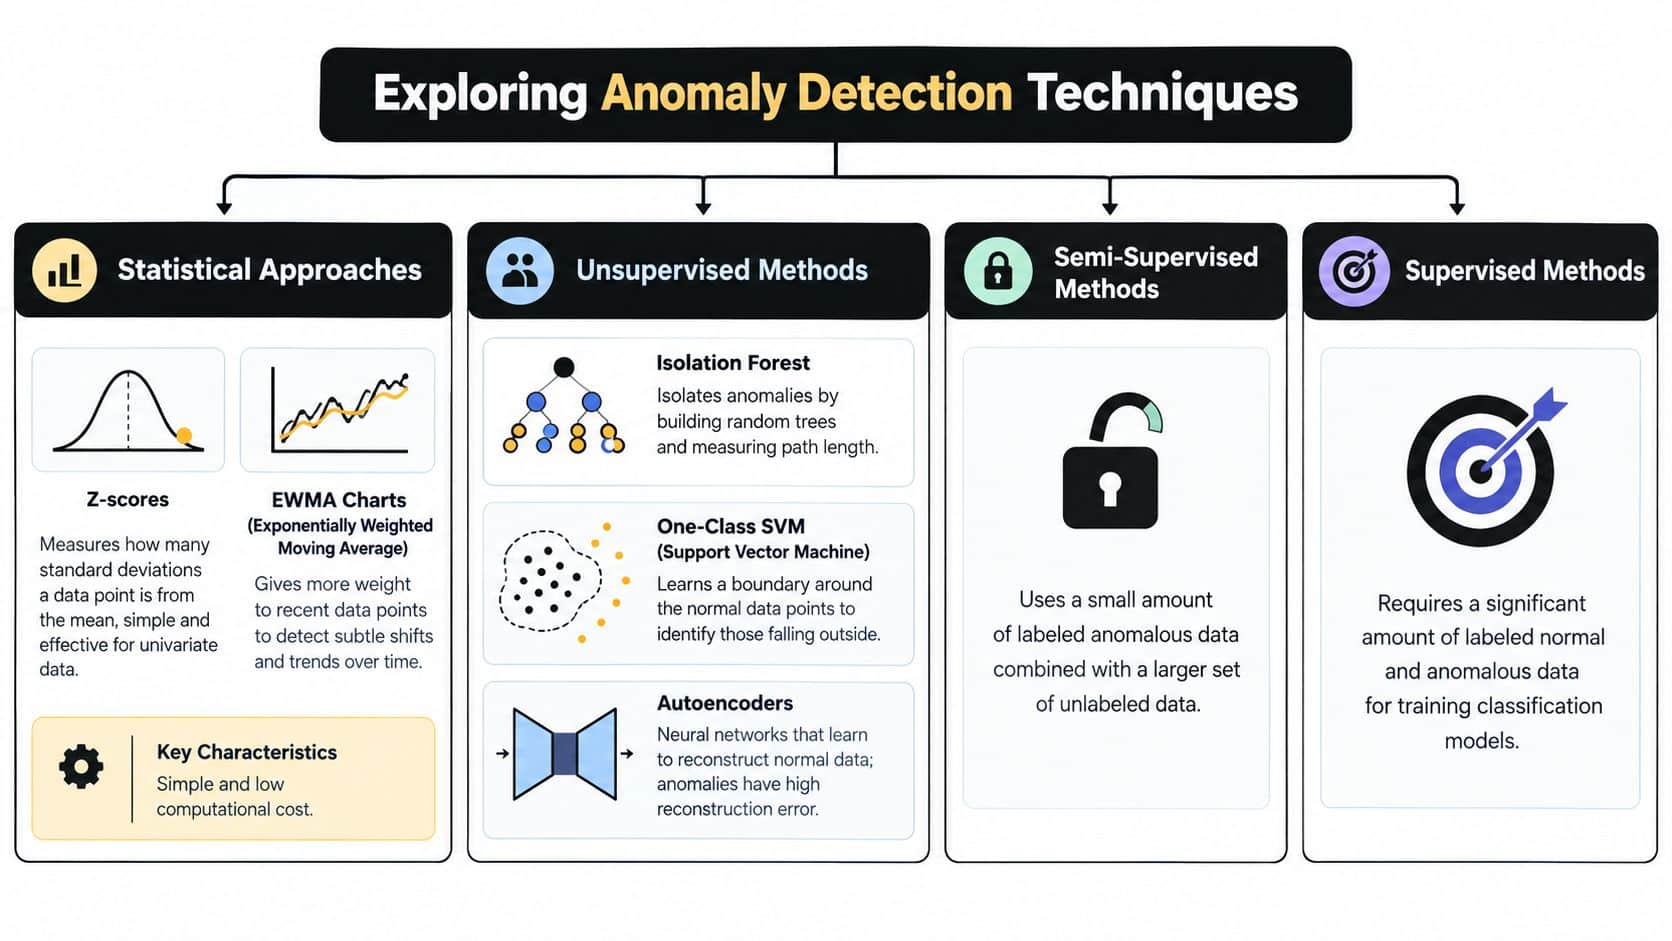
The four broad technique families differ mainly in what they assume, what training data they require, and how much complexity they can handle. A small rule-based baseline may outperform a deep model when the signal is simple and response time matters. A neural approach may be justified when images, multivariate telemetry, or long sequences carry the important information.
Statistical approaches
Statistical methods provide a direct starting point. A z-score measures how far an observation sits from the mean in standard-deviation terms, which makes it useful for straightforward univariate signals. An Exponentially Weighted Moving Average, or EWMA chart, gives more influence to recent observations, helping detect a gradual shift in a time series.
These methods are transparent and computationally light. An operations team can explain why a reading exceeded its expected range, and engineers can often implement the calculation close to the data source. Their weakness appears when the baseline changes, variables interact, or the data has complex seasonality. A single global threshold may flag normal behavior during a busy period and miss a subtle issue during a quiet one.
Unsupervised methods
Unsupervised models learn from data without requiring a complete catalog of labeled anomalies. Isolation Forest isolates observations through randomly selected tree splits. Anomalies tend to require shorter paths because they're easier to separate from the rest of the data.
Isolation Forest uses a fixed per-tree subsample size of min(N, 256), and its flagging threshold is derived from training data through score-threshold and contamination logic, as documented in the Isolation Forest implementation guidance. The commonly used max_samples setting is 256, with one explanation linking that choice to a maximum tree size of log(256)=8, which keeps trees shallow and computation bounded in typical use according to this Isolation Forest guide.
One-Class SVM learns a boundary around normal observations, while autoencoders learn to reconstruct normal inputs. An input that reconstructs poorly receives a larger anomaly signal. These options are valuable when labels are scarce, but they still need careful feature preparation, threshold tuning, and validation against realistic operating conditions.
Supervised and semi-supervised learning
A supervised classifier learns from labeled normal and anomalous examples. This approach can be powerful when the business has reliable historical labels, such as confirmed fraudulent transactions or known equipment failures. It struggles when new failure modes appear or when labels reflect only what people happened to notice.
Semi-supervised methods occupy the middle ground. They use a smaller labeled anomaly set alongside a larger unlabeled collection, which fits environments where abnormal events are expensive or difficult to document. Teams should also consider inference speed, memory, and retraining effort rather than focusing on classification quality alone.
Deep learning approaches
Deep learning handles complex representations. CNN-based detectors can analyze spatial structure in industrial images, while Transformer-based systems can model relationships across long sequences or heterogeneous telemetry. These models may uncover patterns that simpler methods miss, but they demand more data preparation, infrastructure, testing, and explainability work.
The ADBench benchmark research evaluated 30 algorithms across 57 datasets and 98,436 experiments. IM-IAD standardized 19 algorithms across seven manufacturing datasets and compared unsupervised, fully supervised, few-shot, continual, noisy-label, memory, and inference-speed settings. The broader lesson is clear: supervision level, anomaly type, and efficiency constraints can matter more than the model family itself. For a practical comparison of implementation choices, see machine learning anomaly detection.
Preparing Data for Anomaly Detection
A model can't rescue a dataset that doesn't represent production. Data preparation should begin with the behavior you want to protect, not with the algorithm your team happens to know best.
Build a representative collection
Start by collecting normal behavior across the conditions users and machines experience. Include quiet periods, busy periods, device variations, customer segments, operating modes, and known maintenance windows where relevant. Normal data isn't one narrow line. It's the full range of acceptable behavior.
Then gather anomalies from incident records, fraud reviews, support tickets, equipment inspections, security investigations, and postmortems. Label the event as precisely as the evidence allows. A vague “bad” label can train the system to detect an investigator's uncertainty instead of a meaningful failure pattern.
Rare events create a difficult labeling problem. The class imbalance can fall below 0.1% in log and transaction data, while database-specific behavior makes reproducible evaluation difficult, as described in this review of open benchmarks and explainability challenges. In that situation, random train-test splitting can place nearly identical events in both sets and make performance look better than it is.
Engineer context, not just values
For time-based systems, aggregate behavior over meaningful windows. Count actions, calculate moving summaries, capture changes from a user's normal baseline, and preserve ordering when the pattern itself matters. Add context such as account age, device, region, service state, production recipe, or time of day, provided the application can obtain that information reliably at scoring time.
Synthetic anomaly injection can help when real examples are scarce. Introduce controlled spikes, missing values, unusual combinations, corrupted images, or sequence disruptions that reflect plausible failure modes. Synthetic records shouldn't replace real validation. They're useful for testing whether the pipeline responds to a known perturbation and for exposing implementation bugs.
Industrial inspection teams should test beyond a small legacy benchmark. MVTec AD 2 adds eight anomaly scenarios and more than 8,000 high-resolution images, while Real-IAD adds 150K high-resolution images across 30 objects, according to the MVTec AD 2 benchmark description. That wider variation helps reveal failures in cross-category transfer, localization, and reliability.
Data principle: Split data by time, asset, customer, or production context when leakage is possible. A detector should face conditions that resemble its future workload, not a conveniently similar copy of its training set.
Keep a data contract alongside the model. Document feature definitions, missing-value handling, timestamp semantics, label provenance, and the conditions under which a score is valid. Reproducibility begins before training starts.
Typical Use Cases and Examples
Anomaly detection earns its place in an application when it changes a decision. The decision might be to hold a payment, investigate an incident, inspect a product, or scale a service before users feel the impact.
Fintech and ecommerce fraud
A payment service receives a stream of purchases from a mobile app. Most events are ordinary, but one account begins using a new device, changing its purchase rhythm, and submitting several transactions that don't fit its established behavior. A contextual or sequence-aware detector can combine those signals instead of judging each purchase in isolation.
The application might assign a risk score, request additional verification, or route the event to a review queue. The model doesn't need to declare guilt. It needs to prioritize scarce human attention while avoiding unnecessary friction for legitimate customers.
IT operations and cybersecurity
A SaaS platform records infrastructure metrics, application logs, authentication events, and API activity. An unsupervised detector can learn the shape of routine CPU, memory, latency, or request behavior, then flag an unusual spike or combination of events.
The operations team still needs context. A CPU increase during a planned deployment may be expected, while the same increase alongside authentication failures and database latency may deserve escalation. Linking the score to deployment calendars, service ownership, and incident tooling turns an alert into an actionable investigation.
Manufacturing quality control
A camera watches products moving along a production line. A vision model can identify scratches, dents, missing components, or shape deviations that are difficult to capture through simple numeric thresholds. The detector's output can trigger a human inspection, divert an item, or pause a process for review.
The business value comes from earlier intervention and more consistent inspection, but the system must cope with lighting changes, camera movement, product variations, and new defect types. High-resolution, multi-scenario validation is therefore more useful than a narrow demonstration.
The investment behind these use cases is substantial. One industry estimate valued the global anomaly detection market at US$7.4 billion in 2024 and projected it to reach US$16.8 billion by 2030, with adoption spanning fraud detection, cybersecurity, industrial monitoring, and AIOps, as reported in this anomaly detection market estimate. A separate estimate cited in the same market research context places the market at US$4.70 billion in 2025 and projects US$9.25 billion by 2032, so leaders should treat market sizing as directional rather than as a single definitive total.
A useful business question is not “Can the model find anomalies?” It's “What action will the application take when the model finds one?”
That question clarifies the required latency, review process, audit trail, and acceptable false-alarm rate. It also prevents teams from buying complexity without defining an operational outcome.
Evaluating and Choosing Anomaly Detection Models
Model evaluation starts with the decision threshold. Most detectors produce a score, then classify an event as normal or anomalous after applying a cutoff. Move that cutoff and the balance between missed events and false alarms changes.
A true positive is an anomaly correctly flagged, while a false positive is normal behavior incorrectly flagged. The true positive rate measures coverage of actual anomalies, and the false positive rate measures how often normal events are incorrectly escalated. A ROC curve plots those two rates across thresholds, as explained in this clinical review of anomaly detection evaluation.
Precision answers, “Of the events we flagged, how many were anomalous?” Recall answers, “Of true anomalies, how many did we catch?” F1-score combines precision and recall into a single balance, while latency describes how quickly the system can produce a usable score.
| Metric | Purpose | When to Prioritize |
|---|---|---|
| True positive rate | Measures the share of real anomalies detected | Safety, security, or reliability cases where missed events carry serious consequences |
| False positive rate | Measures normal events incorrectly flagged | High-volume systems where unnecessary reviews burden operators |
| Precision | Shows how many alerts represent real anomalies | Rare-event workflows where each investigation consumes meaningful time |
| Recall | Shows how much of the anomaly population the system catches | Fraud, failure prevention, or compliance workflows where missed events are costly |
| F1-score | Balances precision and recall | Comparing models when both missed events and false alarms matter |
| Latency | Measures scoring and response speed | Real-time mobile transactions, automated controls, and incident response |
A model that looks strong under one threshold may be unusable under another. Evaluate several thresholds against the actual cost of review, customer friction, downtime, or missed fraud. Don't let a high aggregate score hide poor behavior on the specific anomaly type your business cares about.
A practical selection process
Use time-aware or entity-aware validation when random splitting would leak future behavior or repeated users across datasets. Preserve rare events in validation, but avoid manufacturing an unrealistic class balance that changes the operating problem.
Then compare candidate models on more than detection quality. Include inference latency, memory consumption, retraining complexity, interpretability, resilience to missing data, and the effort required to investigate an alert. A compact statistical or Isolation Forest model may fit an edge or high-throughput workflow, while a deep model may justify its overhead for complex image or sequence patterns.
Monitor the chosen model after release. Track score distributions, feature availability, alert volume, confirmed outcomes, and changes in user or system behavior. Drift can make yesterday's threshold inappropriate even when the software itself hasn't changed. Teams building a broader evaluation practice can use this guide to evaluate AI models.
Deploying Monitoring and Integration Workflows
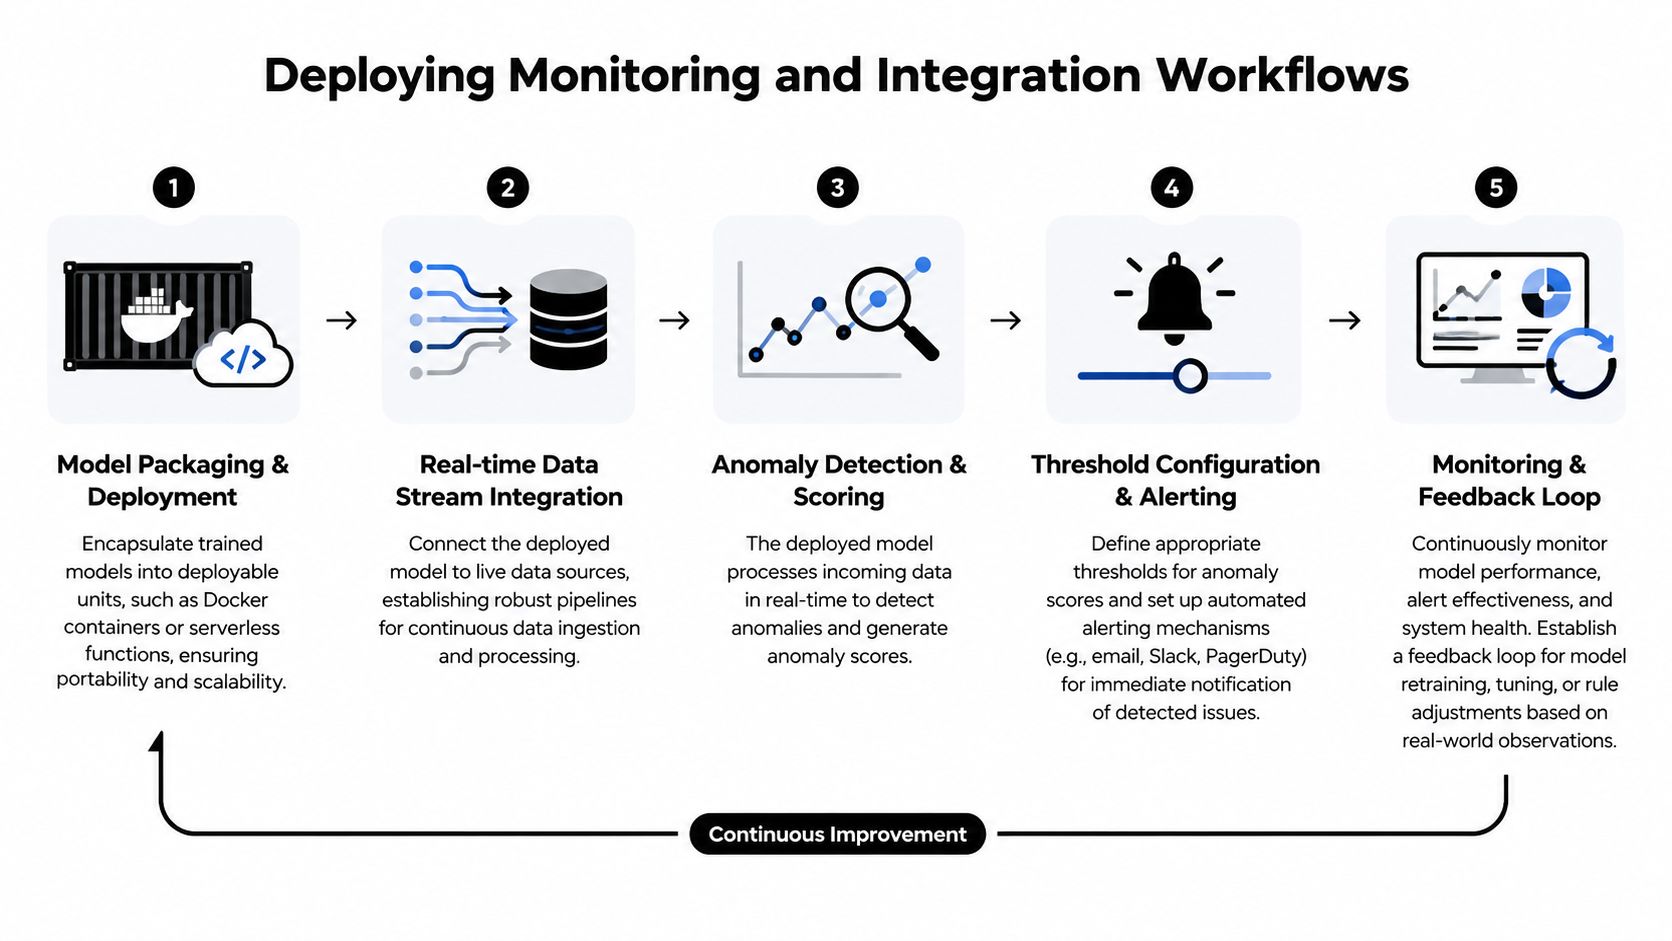
A production deployment needs a path from incoming data to a scored event, an alert, an investigation, and eventual feedback. The model is one component in that path.
Package the scoring service
Encapsulate preprocessing, the trained model, threshold configuration, and output schema in a deployable unit. A container can provide portability across environments, while a serverless function may suit event-driven scoring with variable demand. Keep the version of the model and its preprocessing logic together, because changing feature transformations can alter scores even when the model file stays the same.
Connect live data safely
Feed the scoring service from application events, telemetry streams, image pipelines, or database changes. Validate schemas before inference. Reject or quarantine malformed records, record missing fields, and preserve event timestamps so engineers can distinguish delayed data from actual late behavior.
The workflow below captures the operating sequence.
Score, alert, and learn
A score without an action is just another number on a dashboard. Define what happens at each alert level, who owns the response, and how a reviewer records the outcome. Some events may create a ticket, others may request additional authentication, and high-confidence infrastructure issues may trigger an automated safeguard.
Thresholds should live in configuration rather than hidden inside application code. That makes controlled tuning possible and gives reviewers a clear audit trail. Alert routing can include email, Slack, PagerDuty, or an internal operations queue, depending on the response process.
A feedback loop closes the gap between offline testing and production reality. Feed confirmed outcomes back into validation, review changes in score distributions, and create retraining triggers for meaningful drift or data-quality failures. The anomaly detection systems guide provides additional context for building this kind of operational workflow.
Add administrative controls for AI-assisted investigation
Many teams use an AI service to summarize an alert, generate an investigation brief, or translate technical evidence into a business-facing explanation. That layer needs governance of its own.
A prompt vault with versioning lets engineers update anomaly-description templates without losing the history of prior instructions. A parameter manager can control which database fields or query parameters an AI-assisted investigation may access. Unified logging across integrated AI services gives developers a way to trace which model, prompt, and input produced an explanation.
Cost visibility matters too. High-frequency scoring or explanation requests can create cumulative spend that's difficult to spot when each individual call looks small. A cost manager can help entrepreneurs and engineering leaders review spending across integrated AI services and connect usage to the workflows generating it.
Best Practices and Trade-Offs for Production Systems
Production design is a balancing act. A statistical detector or lightweight unsupervised model may suit a low-latency path where every event must be scored quickly. A deep learning model can better represent complicated images or sequences, but it brings greater infrastructure, validation, and maintenance requirements.
Choose the simplest model that captures the business failure mode. If a stable operating range explains the problem, begin with a statistical baseline. If labels are scarce, evaluate unsupervised or semi-supervised options. If the signal depends on spatial structure, long-range sequence relationships, or several interacting variables, test a representation-learning approach.
False alarms deserve the same attention as missed anomalies. Too much sensitivity can flood an operations team until alerts become background noise. Too little sensitivity can leave serious events invisible. Set thresholds with the people who respond to alerts, then review whether the action is worth the investigation effort.
Cost also has two sides. Model infrastructure consumes resources, and AI-generated explanations or summaries can add usage across a high-volume workflow. Use budget alerts, review cumulative spend, and separate essential scoring from optional enrichment. A prompt vault, parameter controls, service logs, and cost tracking can make that boundary easier to manage.
Guardrails that protect trust
- Explain the trigger: Store the features, context, score, threshold, and relevant evidence that led to an alert.
- Audit regularly: Review false positives, missed anomalies, threshold changes, and model versions with both technical and business owners.
- Protect sensitive data: Limit database access and redact information before sending records to an external AI service.
- Plan for drift: Define what happens when schemas, customer behavior, sensor conditions, or traffic patterns change.
- Keep a human path: Let authorized reviewers override, resolve, or escalate alerts, especially in financial, healthcare, and public-facing systems.
Foundation models, Transformers, diffusion methods, and zero-shot or few-shot approaches are attracting attention, but reliable performance across domains remains an open practical question. Current discussion highlights unresolved challenges involving domain shift, heterogeneous telemetry, and cross-dataset benchmarking, as reflected in the CVPR workshop agenda on anomaly detection foundation models. A model that performs well on a popular benchmark still needs testing against the data, latency, memory, explainability, and operating constraints of your application.
Wonderment Apps can help modernize existing software with AI integrations and administrative tooling for prompts, data-access parameters, service logging, and cumulative AI cost tracking. To discuss an anomaly detection workflow that fits your web, desktop, or mobile application, visit Wonderment Apps and request a demo of the prompt management system.