


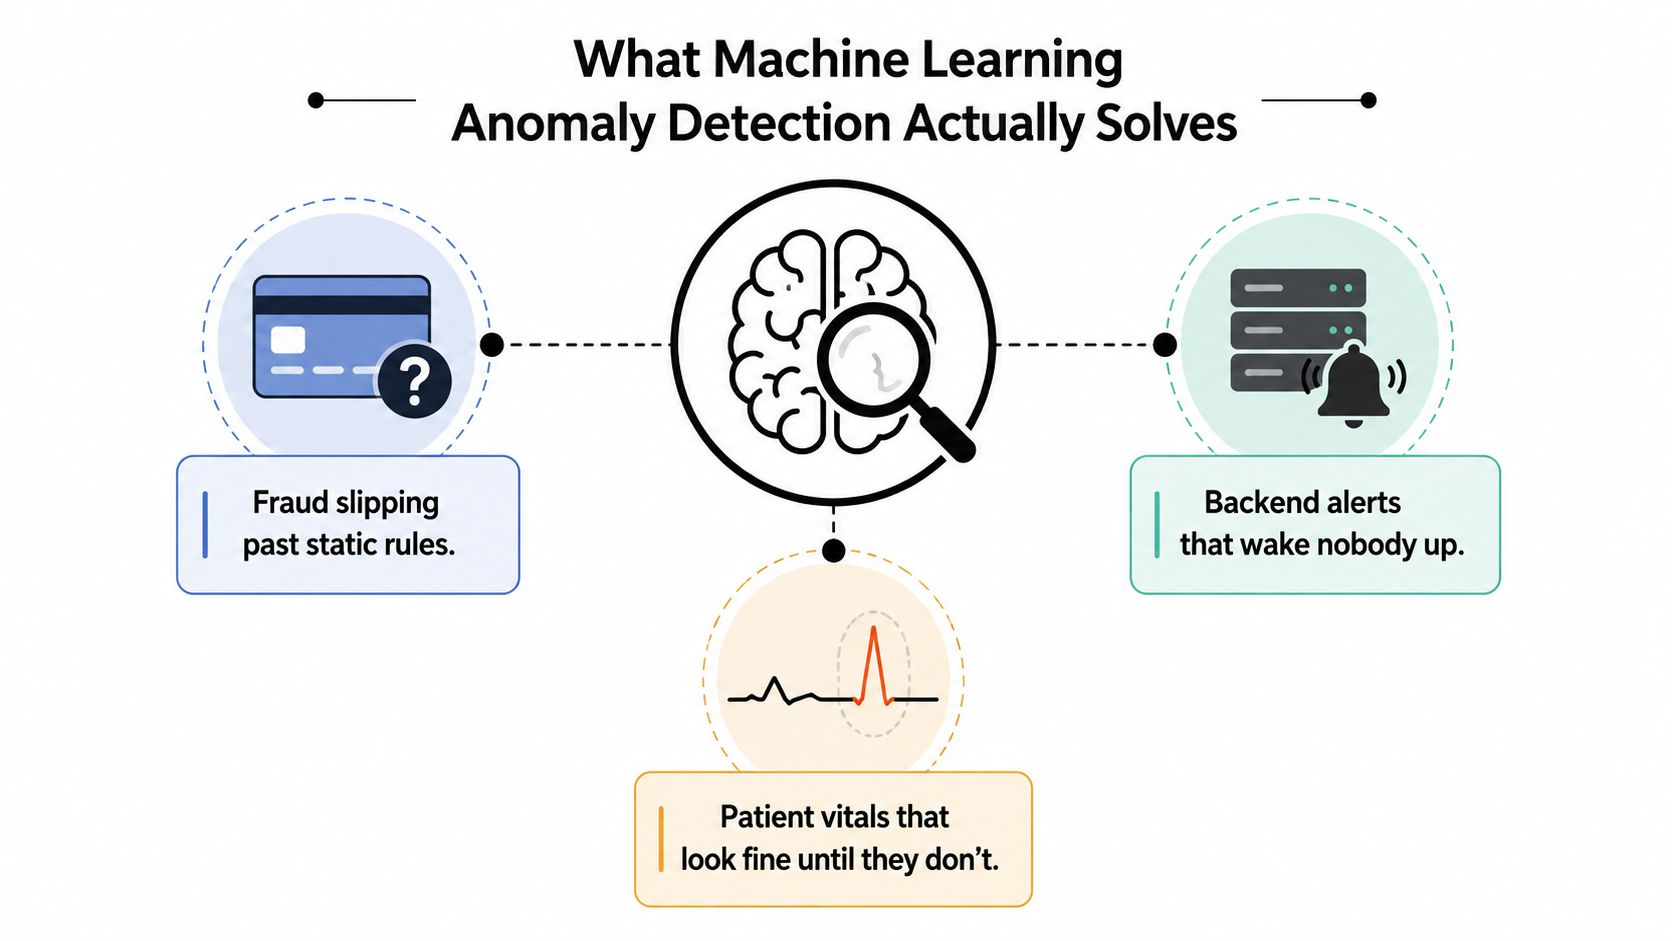
A fraud alert slips through a fixed threshold because the customer is traveling. A backend monitor sends another notification that nobody trusts enough to investigate. A patient's vital signs look ordinary until a subtle pattern changes. These incidents share a problem: the application sees plenty of data, but it doesn't understand which changes deserve attention.
Machine learning anomaly detection helps software recognize behavior that differs from an established baseline. It can support fraud screening, cybersecurity, equipment monitoring, healthcare workflows, and reliability features inside desktop and mobile applications. The difficult part isn't choosing an impressive model. It's building a system that handles scarce labels, respects latency limits, gives people useful alerts, and keeps its operational costs visible.
Teams modernizing existing products also need an orchestration layer around AI services. A prompt vault, parameter manager, unified logging, and cumulative cost view can help developers manage the surrounding AI workflow instead of scattering configuration across application code.
What Machine Learning Anomaly Detection Actually Solves
A conventional rule says, “Flag every transaction above a fixed amount.” That rule is easy to explain, but it misses a smaller purchase made from a new device, or it blocks a legitimate customer whose behavior changed because they're abroad. A machine learning system can consider several signals together, such as timing, device context, location patterns, account history, and transaction relationships.
Anomaly detection asks a practical question: does this observation look sufficiently different from normal behavior? Machine learning changes the answer from a collection of hand-tuned thresholds into a model that can learn patterns from historical data. The model doesn't need a complete catalog of every future failure. It can learn the shape of ordinary activity and score deviations for review.
Three kinds of unusual behavior
- Point anomalies: One observation is unusual by itself. A payment may be far outside an account's normal pattern.
- Contextual anomalies: The observation makes sense in one context but not another. A traffic spike might be normal during a product launch but suspicious at another time.
- Collective anomalies: A sequence or group of ordinary-looking events becomes suspicious together. Repeated login attempts, credential changes, and a new payout destination may form a meaningful pattern.
These categories matter because a point detector may miss a contextual or collective event. Product teams should define the anomaly they care about before selecting a model.
Why labels are usually incomplete
A supervised model learns from examples marked normal or anomalous. That approach works well when an organization has reliable historical labels, but rare failures and new attack patterns are difficult to enumerate. Unsupervised methods learn primarily from normal behavior, while semi-supervised methods use a trusted collection of normal examples and identify deviations.
The historical record supports this design choice. A 2024 survey reports that 65% of methods proposed between 1980 and 2000 were unsupervised, and it describes research output as relatively constant from 1990 to 2016 before rising sharply after 2016. The survey also reports that almost 50% of newly introduced methods from 2020 to 2024 used prediction models such as LSTMs and autoencoders (2024 time-series anomaly detection survey).
Practical rule: Define the cost of a missed anomaly and the cost of an unnecessary alert before you define the model.
For teams building AI-enabled products, anomaly detection may sit beside recommendation engines, assistants, and workflow automation. A broader overview of machine learning for businesses can help product leaders think about where detection belongs in the application rather than treating it as an isolated data science experiment.
The Core Algorithm Families and When to Use Each
Algorithm selection becomes clearer when every method gets judged against the same questions: what does it assume about normal data, how much training data does it need, how quickly can it score new events, and how clearly can a human understand the result?
Tree-based isolation methods
Isolation Forest separates observations by repeatedly partitioning the feature space. Unusual points often become isolated with fewer partitions, which makes the method useful when the dataset has many dimensions and labeled failures are scarce.
It's a strong first candidate for fast transaction screening, especially when a product needs a lightweight score before sending a suspicious event to a deeper analysis stage. Tree decisions can also be easier to inspect than a neural reconstruction error, although the final explanation still depends on the features and implementation.
Density-based methods
Local Outlier Factor compares a point's local density with the density around its neighbors. DBSCAN identifies dense groups and treats points outside those groups as noise. These methods fit situations where neighborhood behavior matters more than a single global shape.
For example, a customer segment may have several legitimate behavior clusters. A global detector could treat one valid cluster as unusual, while a local method can ask whether an event is strange relative to its nearest peers. Density methods can become awkward as dimensions grow or as the data distribution changes, so test them on representative feature sets.
Kernel and boundary methods
One-Class SVM learns a boundary around normal examples. It's a sensible option when the training set is relatively small, clean, and representative, and when the team wants a principled boundary rather than a simple distance score.
The trade-off is operational. Kernel methods can require careful scaling and parameter tuning, and their scoring cost may be less attractive for a high-volume stream. They're often worth shortlisting for a focused use case, not adopting by default.
Reconstruction-based neural methods
Autoencoders learn to reconstruct normal inputs. A large reconstruction error becomes an anomaly signal. Variational autoencoders add a probabilistic latent representation, while LSTMs model sequences and can capture temporal relationships that ordinary point-based detectors miss.
These models are useful for multivariate sensor streams, application telemetry, and other data where several signals evolve together. They need disciplined feature pipelines, stable training data, and stronger monitoring than a small tree model. For maintenance teams connecting detection to operational workflows, this guide to reducing downtime with ML provides useful context for thinking about the path from a signal to an action.
A practical shortlist often includes one lightweight isolation method, one local or boundary method, and one reconstruction model. Compare them on the same split, the same alert policy, and the same production constraints. There's no universal winner. The best choice depends on the shape of normal behavior and the response time your application can afford.
Preparing Your Data and Handling the Labeling Problem
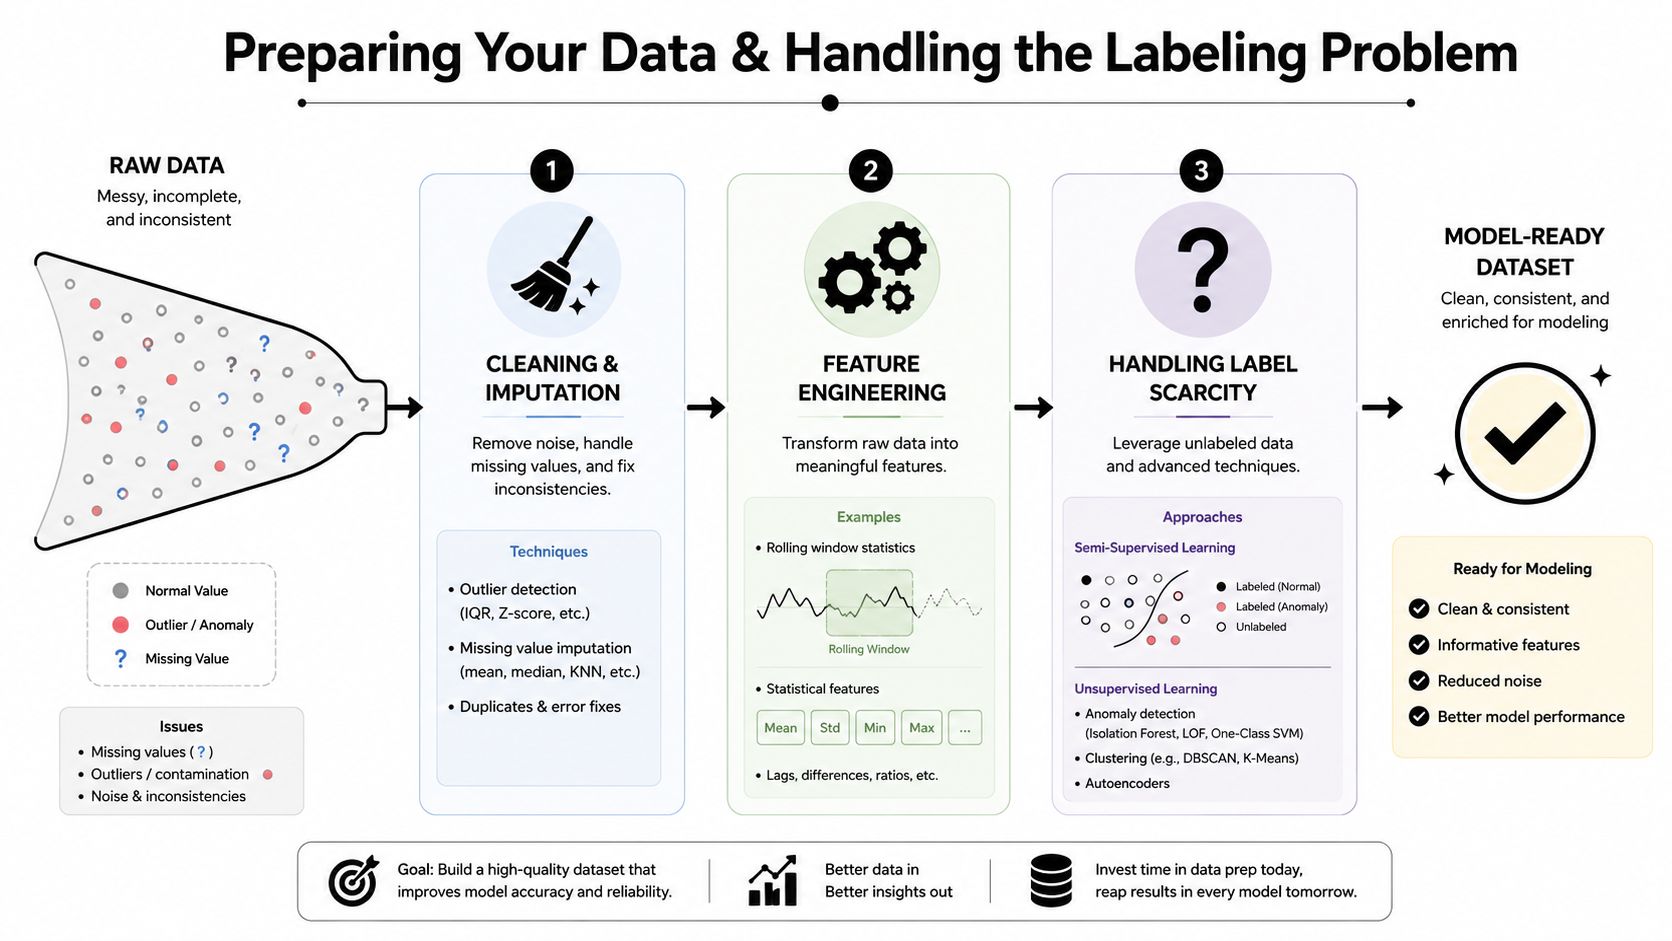
Most anomaly projects struggle before model training begins. A detector can't learn a useful baseline from duplicated events, broken timestamps, missing fields, or a “normal” dataset contaminated with incidents.
Start with the data contract. Define event time, entity identity, feature units, allowable missingness, and the action associated with a high anomaly score. Impute missing values only when the imputation method makes sense for the domain. A missing sensor reading may mean a technical failure, not a value to replace with a median.
Build features that preserve context
Raw values rarely tell the full story. Useful features can include:
- Rolling statistics: Recent mean, spread, minimum, and maximum can expose gradual drift.
- Change features: Differences, ratios, and rates of change can reveal sudden movement.
- Cross-signal relationships: A temperature reading may be ordinary alone but unusual when pressure and load move in a different direction.
- Entity context: Compare a transaction with the customer's prior behavior, or a device with its own baseline rather than a fleet-wide average.
Keep feature generation consistent between training and serving. A feature calculated with future data during training creates leakage, and the model will appear smarter in testing than it is in production.
Choose a labeling strategy deliberately
- Unsupervised: Train without anomaly labels. This is useful when incident records are weak or the system needs to discover unfamiliar behavior.
- Semi-supervised: Train on trusted normal examples. This often matches operational reality because teams can identify healthy periods more easily than every failure mode.
- Supervised: Train with both normal and anomaly labels. This can work when reviewers have created a dependable event history.
ADBench evaluates 30 algorithms across 57 benchmark datasets and includes 98,436 experiments across unsupervised, semi-supervised, and supervised settings (ADBench benchmark). Its practical lesson is important: performance can shift materially when label availability and corruption patterns change, so don't tune one model on one convenient dataset and call the problem solved.
Create a feedback loop
Use heuristics as weak labels, ask reviewers to classify the most uncertain alerts, inject carefully designed synthetic anomalies, and feed confirmed outcomes back into evaluation. Synthetic events shouldn't replace real incidents, but they can test whether the pipeline responds to known changes.
A reviewer workflow also belongs in the product design. Give analysts the relevant features, event history, model version, and reason codes. Without that context, people will click “dismiss” until the alert queue becomes decorative.
Choosing the Right Evaluation Metrics for Your Use Case
Accuracy often misleads anomaly detection teams because normal events usually dominate the dataset. A detector that predicts “normal” almost every time can achieve an attractive accuracy score while missing the rare events that matter.

Read the metrics as operating choices
Precision asks how many flagged events are genuinely useful. High precision protects analysts and customers from unnecessary interruptions. Recall asks how many real anomalies the system catches. High recall matters when a missed event carries serious consequences. F1 balances both, but it can hide the business preference if precision and recall have very different costs.
The precision-recall curve shows how those values change as the alert threshold moves. Lowering the threshold may catch more anomalies while producing more false positives. Raising it may create a calmer queue while allowing more dangerous events through.
Consider checkout fraud. A false positive can block a legitimate customer, while a false negative can allow a fraudulent payment. The product team might send medium-confidence events to a review queue and reserve checkout interruption for stronger signals. In healthcare monitoring, the cost of a missed deterioration signal may outweigh the burden of additional clinical review, so recall deserves more weight.
For a broader framework on testing AI systems, see AI model evaluation. The same discipline applies here, but anomaly detection adds a human alert workflow that needs its own success criteria.
Measure the system around the model
Track alert volume per analyst, time to detect, time to acknowledge, and time to resolution. Also record how often reviewers override the score and whether confirmed events improve future training data. A model with strong offline metrics can still fail if it produces alerts at the wrong time or gives responders no actionable context.
Anomaly Detection in Ecommerce, Fintech, and Healthcare
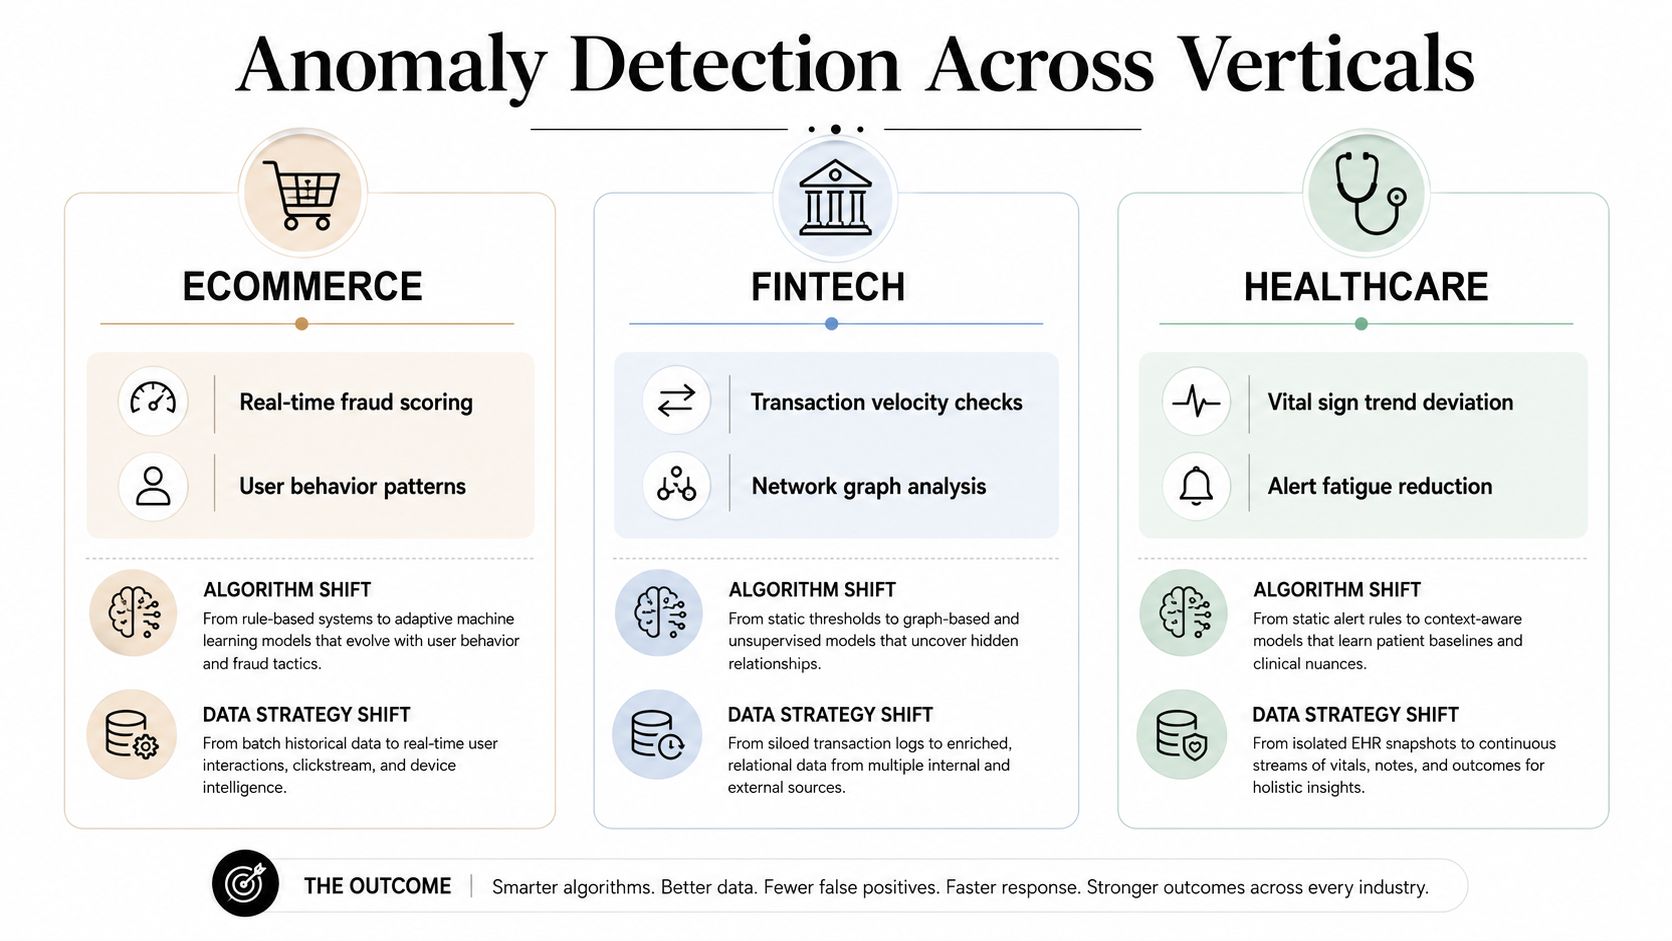
The same detector can behave very differently across industries because each product defines “normal” differently and assigns a different cost to error.
Ecommerce checkout and inventory
An ecommerce team may score a transaction during checkout using device signals, account history, basket composition, and behavioral context. Isolation Forest can provide a quick first-pass score, while a rules layer handles obvious policy violations and a reviewer or second model handles ambiguous cases.
The team should protect legitimate conversion. Blocking too many good orders creates customer friction, so precision and review capacity matter. The same platform can monitor inventory events, where an unexpected stock change might indicate a synchronization problem, a warehouse issue, or an integration error.
Merchants evaluating fraud operations should also understand the business context behind elevated chargeback rates. An anomaly score is useful only when the product connects it to payment decisions, review queues, and customer recovery processes. For a deeper application-oriented example, see Wonderment's guide to fraud detection with machine learning.
Fintech transactions and account takeover
Fintech systems often combine transaction monitoring with identity and account behavior. A single event may look ordinary, but a sequence involving login changes, unusual transfer behavior, and a new beneficiary can form a collective anomaly.
A hybrid pipeline works well conceptually here. A lightweight detector can screen events quickly, then an LSTM autoencoder or another deeper model can inspect the temporal pattern. A 2026 transaction-focused review reports that 75% of approaches were unsupervised or semi-supervised, and describes hybrid systems combining Isolation Forest with LSTM autoencoders; it associates those systems with 30 to 50% fewer false positives and sub-100ms response times in real-time fraud settings (transaction anomaly detection review).
Healthcare vitals and claims
Healthcare monitoring raises the cost of missing a meaningful change. A reconstruction model can examine several vital signals as a sequence, while a separate rules layer can catch hard safety boundaries. The application should preserve audit trails, limit access to sensitive data, and make the alert rationale understandable to clinical users.
Claims systems present a different pattern. The detector may compare provider, procedure, timing, and patient context to identify unusual combinations. In both cases, false positives contribute to alert fatigue, but a team shouldn't optimize calm dashboards at the expense of clinically important recall.
Deployment Patterns, Latency Budgets, and Monitoring
Shipping a detector is a software engineering task before it's a model-selection task. The team needs a reliable event path, feature consistency, versioned artifacts, failure handling, and an explicit decision about what happens when the detector is unavailable.
Batch scoring fits retrospective analysis, daily investigation queues, and reports where delayed detection is acceptable. It can use inexpensive infrastructure and larger feature windows. Streaming inference fits checkout decisions, transaction authorization, live security events, and operational telemetry where the application needs a result during the user or system interaction.
Match the serving pattern to the request path
A small Isolation Forest can run inside an application service or a lightweight scoring component. A neural model may need a dedicated inference service, accelerator support, or careful batching. Don't put a slow detector directly in a customer-facing request unless the product can tolerate its worst-case latency.
A comparative industrial study measured per-packet inference times of 1.3 ms for Isolation Forest, 2.8 ms for OCSVM, 3.1 ms for an autoencoder, and 5.3 ms for a VAE (comparative inference study). These measurements don't define your own service latency, because network, feature retrieval, serialization, and queueing add overhead. They do show why a lighter detector can be valuable as an online screening stage.
Latency budget: Reserve time for feature retrieval and application behavior, not just model inference.
Monitor more than uptime
A deployed detector can return successful responses while becoming less useful. Monitor changes in feature distributions, shifts in the anomaly-score distribution, missing feature rates, and the share of events routed to each action. Compare these signals by customer segment, device type, region, or asset rather than relying only on a global average.
The team also needs a label feedback path. Review outcomes, confirmed incidents, refunds, chargebacks, maintenance findings, or clinical adjudications can arrive later than the original prediction. Store those outcomes with the model and feature versions used at decision time.
Alerting should group related events, suppress duplicates, and route severity to the right team. An anomaly detector that wakes engineers for every small fluctuation trains them to ignore the system, even if its offline validation looks promising.
Keeping Anomaly Detection Honest With the Right Operational Layer
A deployed model isn't finished software. Normal behavior changes, features get renamed, thresholds drift, reviewers change their decisions, and AI services can accumulate costs that nobody sees in the feature budget.
A production application needs an administrative layer that makes those changes visible. For AI-assisted anomaly workflows, that layer should support:
- Prompt versioning: Store and compare prompts used by investigation assistants, explanations, or remediation workflows.
- Parameter management: Manage approved parameters for internal database access and connected AI components without burying them in scattered code.
- Unified logging: Record requests, responses, model or prompt versions, failures, and reviewer outcomes across integrated AI services.
- Cumulative cost management: Give entrepreneurs and product teams a current view of spend across AI providers and workflows.
Wonderment Apps' prompt management system is one example of this type of administrative tooling. It includes a prompt vault with versioning, a parameter manager for internal database access, a logging system across integrated AI services, and a cost manager for cumulative spend. That layer can sit beside anomaly scoring when an application uses AI to explain alerts, prioritize cases, draft work orders, or support human review.
Use a small operating checklist
- Version the detector and its features. A score without its model and feature versions is difficult to reproduce.
- Capture reviewer feedback. Store why a person accepted, dismissed, or escalated an alert.
- Review drift on a schedule. Investigate changes in inputs, scores, alert actions, and confirmed outcomes.
- Test fallback behavior. Decide whether the application queues an event, uses a simpler detector, or continues with a safe default.
- Audit cost and access. Know which AI workflow generated each expense and which internal data it could reach.
The field is moving toward interpretable, adaptive, and federated approaches, but cross-domain generalization remains under-explored. A 2026 integrative review also notes that standard evaluation metrics and datasets are still lacking, which makes reproducibility harder (integrative anomaly detection review). Your operational layer can't solve that research gap, but it can make your own assumptions, changes, and outcomes inspectable.
Wonderment Apps can help you design and integrate a machine learning anomaly detection workflow into a web, desktop, or mobile application, then support the surrounding prompt, parameter, logging, and cost-management needs. Visit Wonderment Apps to discuss a practical modernization plan for an AI-enabled product that can scale and remain maintainable.