

A lot of leaders first notice database problems indirectly. Customers say the app feels slow. Checkout takes too long. Internal teams complain that reports stall, search lags, or new AI features feel awkwardly delayed. Revenue, trust, and adoption all take the hit before anyone says the words “database performance tuning.”
That's why this topic matters far beyond the engineering team. Your database is the fulfillment center of your software business. If shelves are disorganized and every picker takes the long route, it doesn't matter how polished the storefront looks. Modern apps, personalization systems, analytics workflows, and AI-powered experiences all depend on fast, predictable access to data.
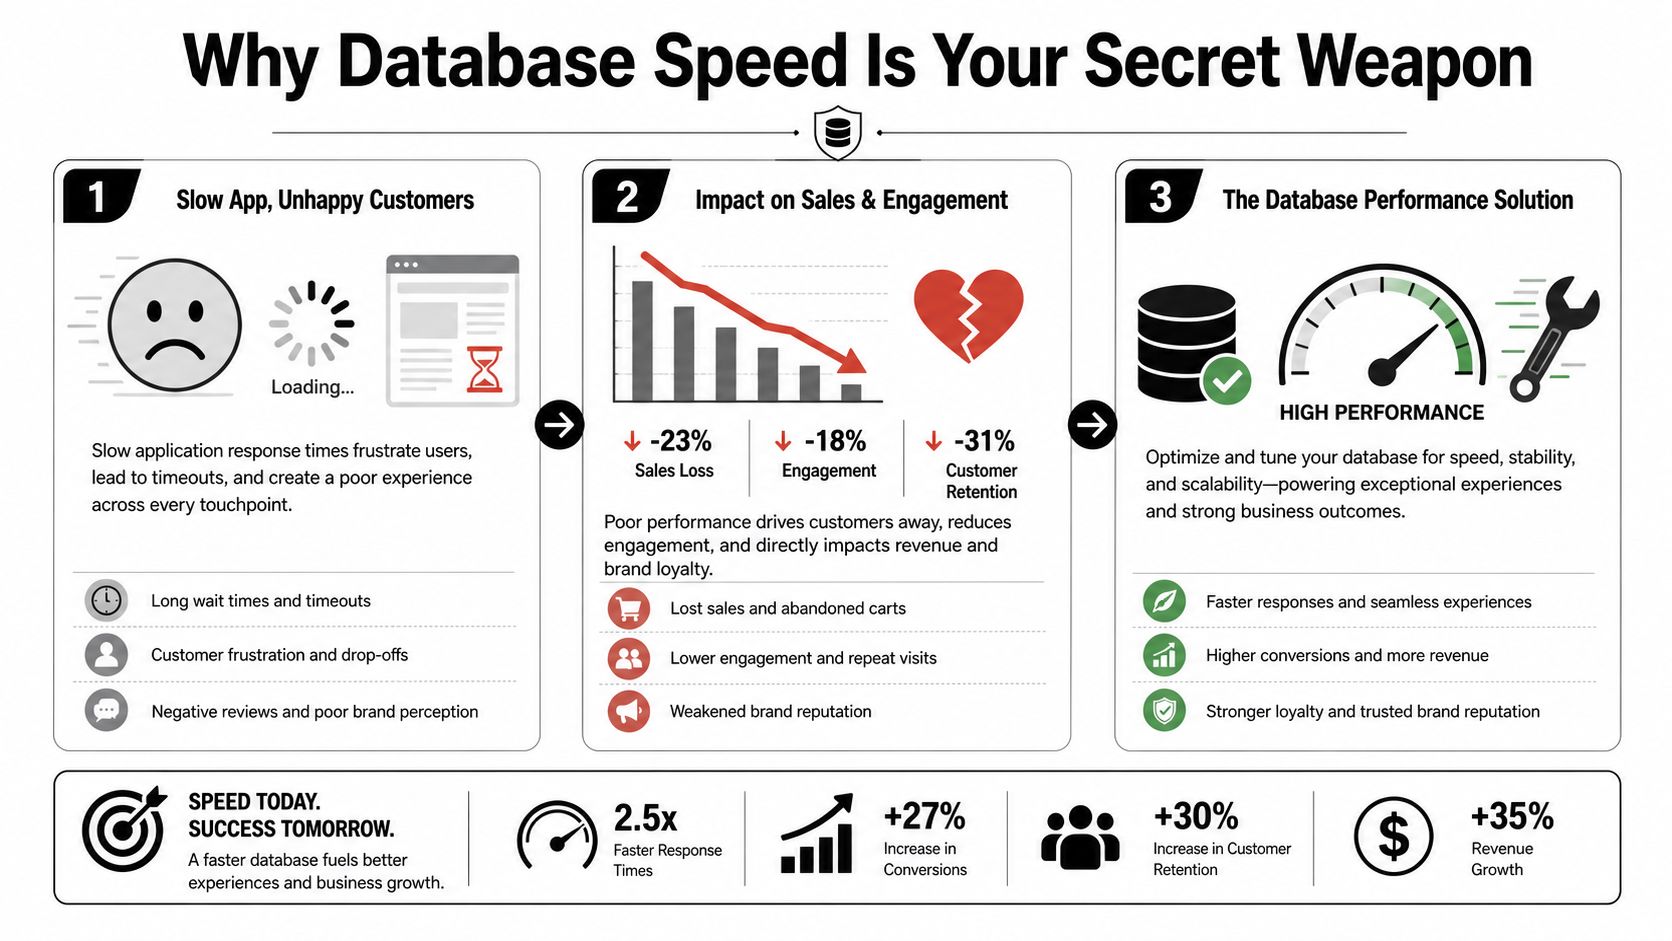
Why Database Speed Is Your Secret Weapon
Slow software rarely announces its root cause. It shows up as abandoned carts, lower engagement, frustrated support tickets, and teams that start blaming “the system” as if the problem were mysterious. In practice, the database often sits close to the center of the issue because it powers the transactions, lookups, and context retrieval that your app performs all day.
What the CEO should care about
A fast database does three things for the business:
- Protects customer experience: Users don't separate app design from app speed. If a page waits on data, the whole product feels unreliable.
- Enhances operational efficiency: Engineers spend less time firefighting timeouts, retries, and odd edge cases caused by overloaded data access.
- Creates room for growth: You can add features, channels, and AI capabilities without turning every launch into a performance gamble.
There's also a gap many teams miss. A lot of tuning advice focuses on the database server while ignoring how the application talks to it. One useful example is the N+1 query problem, where the app fetches one record and then issues many follow-up queries instead of batching the work. One analysis argues that poor ORM usage and missing batch fetching can drive 70% more total database time than inefficient indexes in real-world application stacks, especially where query patterns are the actual source of latency (CloudRPS on database and application tuning).
Practical rule: If customers say the app is slow, ask whether the issue starts in the user flow, the application query pattern, or the database engine itself. Don't let the team skip straight to hardware.
Database choices also shape performance strategy. If your team is debating relational and document models, a grounded primer on the differences between MongoDB and SQL can help clarify why query style, schema design, and scaling behavior vary so much between systems.
Why this matters even more for AI features
AI features raise the stakes. Recommendations, assistants, search augmentation, fraud workflows, and personalized responses all need timely context from your application data. If that retrieval path is sluggish, the AI layer feels sloppy, regardless of which model you're paying for.
That's why database performance tuning isn't a legacy maintenance task. It's a strategic prerequisite for modern software. Leaders who treat it that way tend to get cleaner releases, calmer engineering cycles, and better-performing customer experiences.
The Art of Diagnosis Finding Your Performance Bottlenecks
The worst way to tune a database is to start changing things because the app “feels slow.” That's like prescribing medicine before checking the patient's vitals. Good teams diagnose first, and they do it in a way they can repeat.
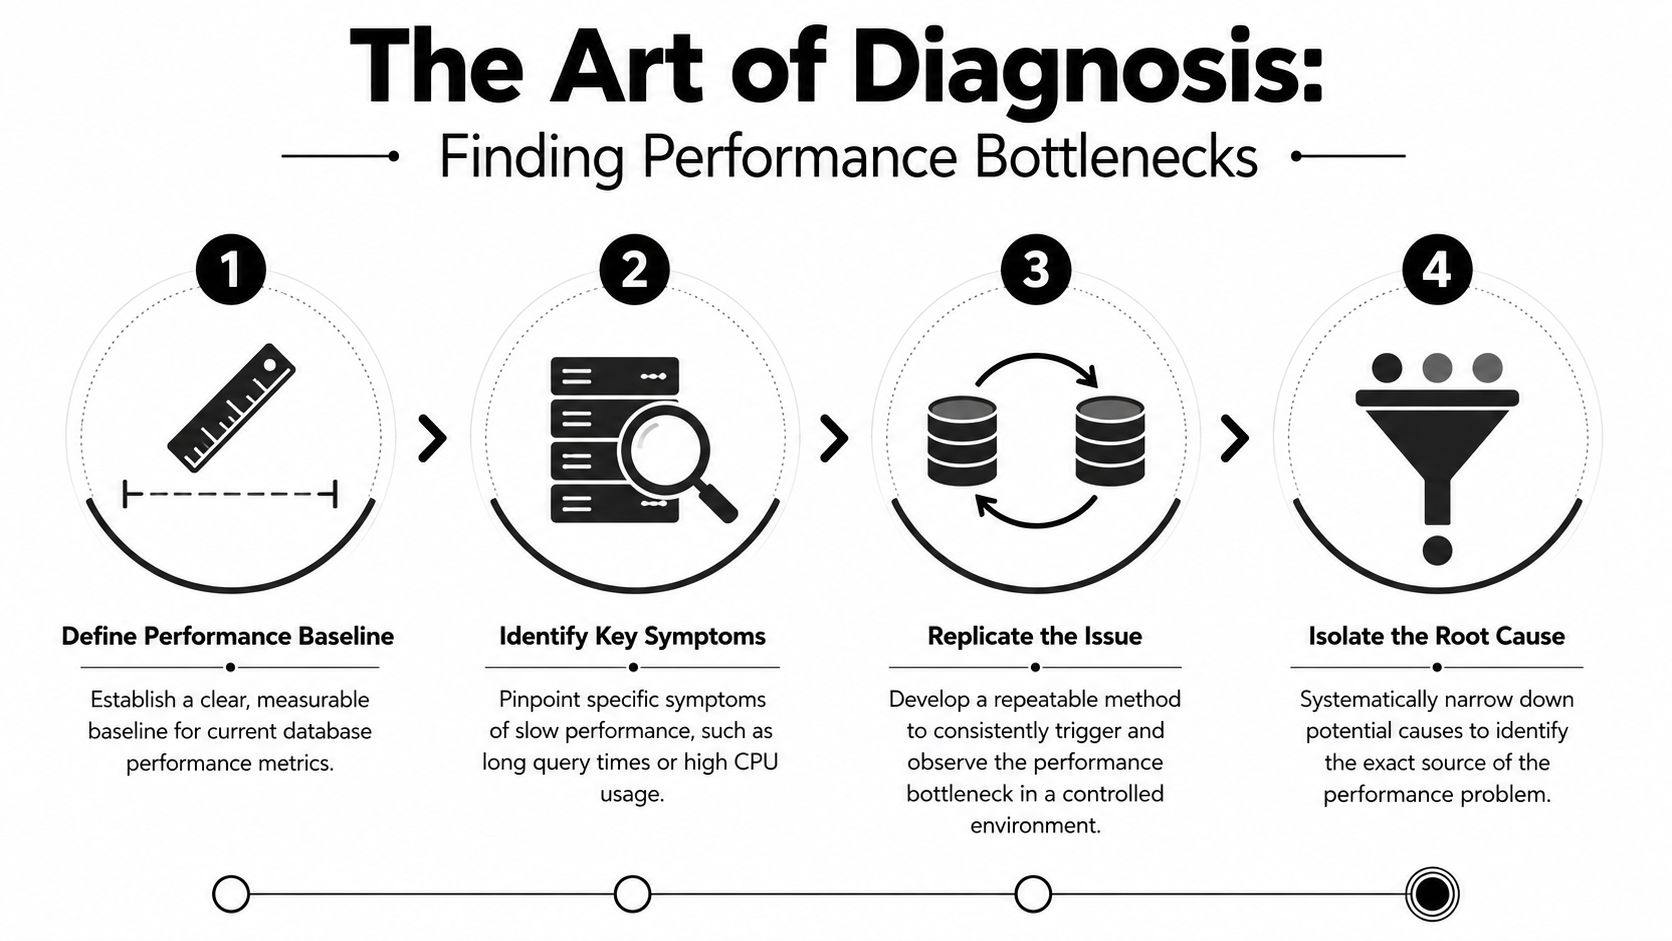
A disciplined approach starts with a baseline. According to Oracle-focused guidance summarized by Cleverence, database performance tuning should begin by measuring query latency, throughput, resource utilization, and wait events, then continue through a repeatable measure, analyze, optimize, validate loop (performance tuning overview).
The four questions to ask first
Before your team changes indexes, memory settings, or schema design, ask these:
What is slow, exactly?
“The app is slow” is not a diagnosis. “Checkout confirmation is lagging” or “product search stalls during peak traffic” is.Can we measure it consistently?
If the team can't recreate the problem under repeatable load, they're guessing.Where does the time go?
Is it query execution, lock contention, disk I/O, CPU saturation, network latency, or application chatiness?What changed?
A new release, a traffic pattern shift, a bulk job, a reporting workload, or a data growth threshold often explains why problems appear suddenly.
What to inspect in practice
A strong diagnostic review usually includes:
- Transaction latency by user action: Focus on business-critical flows like login, search, checkout, reporting, and order updates.
- Throughput by module: Don't average everything together. One weak path can hurt revenue while the rest of the system looks “fine.”
- Resource utilization: CPU, memory pressure, disk I/O, and connection saturation all tell a different story.
- Wait events and execution behavior: In SQL systems, tools such as execution plans, EXPLAIN, SQL Profiler, or engine-specific wait analysis help reveal whether queries are scanning too much data or waiting on locks.
- Workload shape: Batch jobs, exports, AI enrichment pipelines, and operational traffic may compete for the same resources.
Missing metrics makes tuning slower and more political. Teams end up arguing from anecdotes instead of evidence.
Latency isn't always the database's fault, either. Some slowness comes from geography and network distance. If your users, APIs, or data services span regions, work through infrastructure issues too. This overview of Throughwire for reliable China connectivity is a useful reminder that transport path and network routing can distort the picture before a query even reaches the database.
What a CEO should insist on
Ask your team for a one-page performance baseline before approving major optimization work. It should show the slowest customer actions, the systems involved, and the current behavior under controlled load. If they need a framework for that visibility, this guide to performance monitoring tools for scalable apps is a practical starting point.
The key discipline is simple. Measure first. Change one thing. Test again. If the team can't show before-and-after evidence, they haven't tuned the system. They've only modified it.
Low-Hanging Fruit Quick Wins in Query and Index Optimization
The fastest wins usually don't come from dramatic infrastructure changes. They come from fixing the handful of queries that waste the most work.
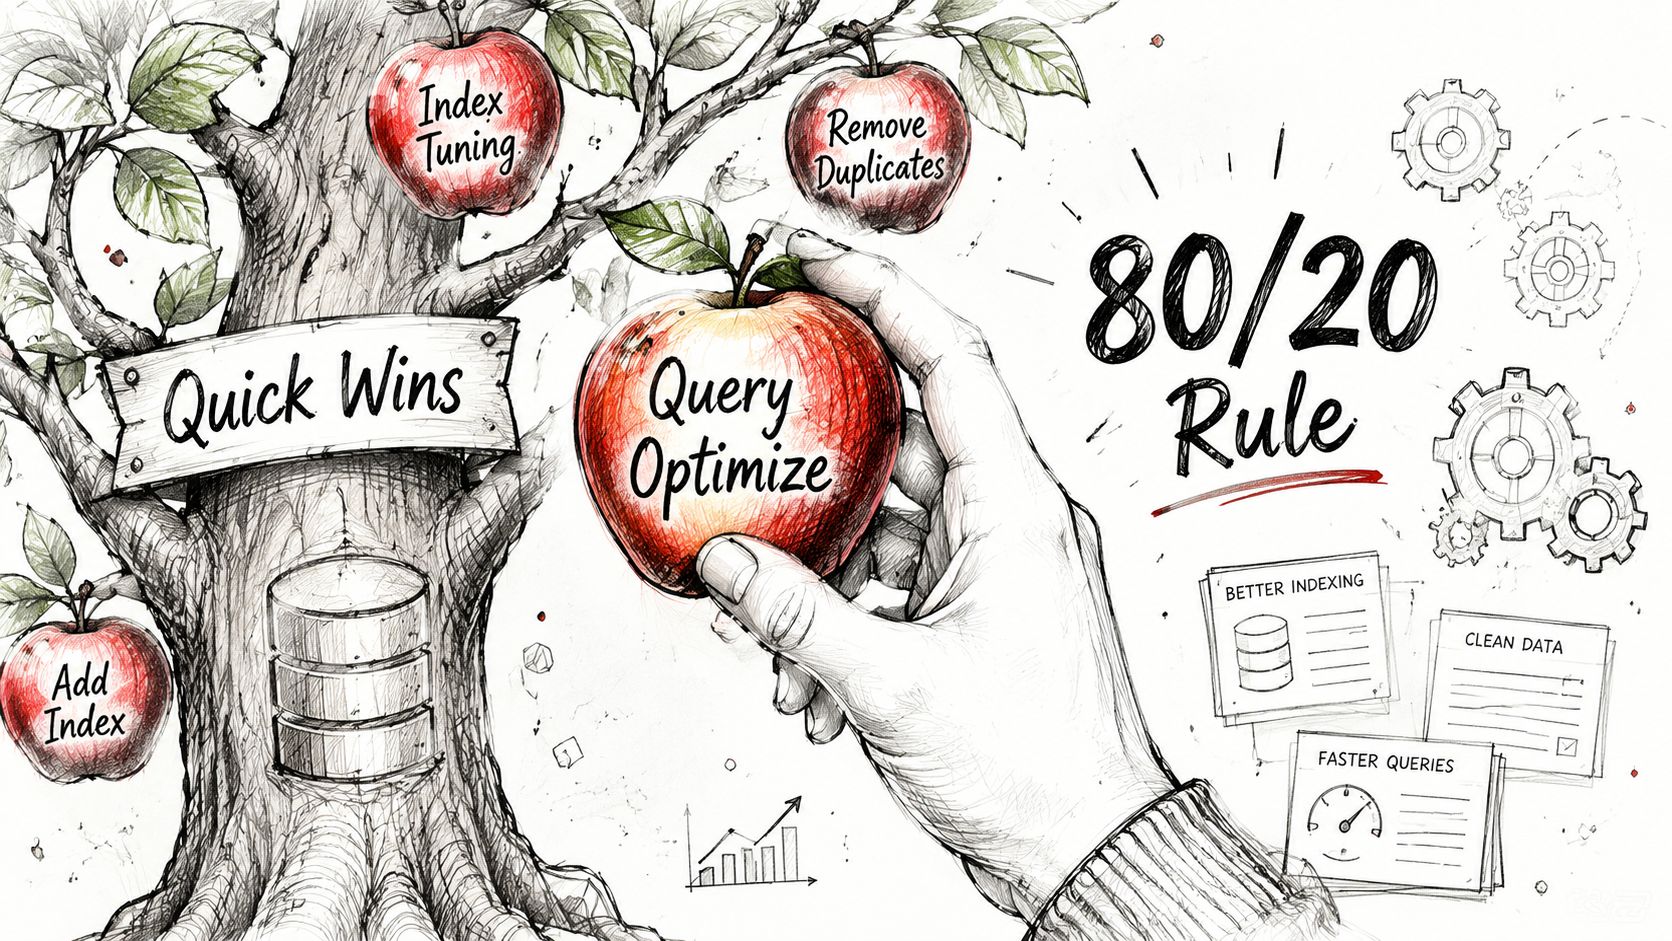
One of the most reliable rules in database performance tuning is to target the heaviest queries first. Validation guidance summarized from benchmark practice notes that the biggest gains tend to come from optimizing the most resource-heavy queries identified with tools like EXPLAIN or SQL Profiler, and it warns against changing multiple variables at once because that hides cause and effect (expert tuning validation guidance).
The classic problem your team should check this week
The N+1 query issue is a common offender in apps built with ORMs. Here's the business version of what happens:
- The app loads a list of 100 orders.
- Then it asks the database for each customer record one by one.
- Then it does the same for products or shipment details.
That's like a warehouse manager sending a worker back to the stock room for every single item on an order instead of picking them in one trip.
A simplified example:
, First query
SELECT id, customer_id, total
FROM orders
WHERE created_at >= CURRENT_DATE;

, Then repeated many times in application code
SELECT id, name, email
FROM customers
WHERE id = ?;
A better approach is usually to batch the retrieval:
SELECT o.id, o.total, c.name, c.email
FROM orders o
JOIN customers c ON c.id = o.customer_id
WHERE o.created_at >= CURRENT_DATE;
That doesn't solve every case, but it shows the principle. Reduce round trips. Retrieve related data intentionally. Don't let convenience in application code create hidden cost at runtime.
Why indexes still matter
Indexes are the table of contents for your data. Without them, the database may inspect far more rows than necessary before finding the answer. With the right index, it can narrow the search dramatically.
A productive review looks like this:
| Question | Why it matters |
|---|---|
| Is the query filtering on columns that have useful indexes? | Without that support, the engine may scan too much data |
| Is the query sorting or joining on expensive fields? | Sorts and joins often become bottlenecks under load |
| Did the team verify the actual execution plan? | Estimated behavior and real behavior can differ |
| Was only one change made before retesting? | Isolating variables prevents false conclusions |
Quick wins that often pay off
- Batch related reads: Replace repeated lookups with joins, eager loading, or grouped fetches where appropriate.
- Review missing indexes on business-critical paths: Search, order history, account dashboards, and reporting filters deserve special attention.
- Trim waste from large result sets: Don't select columns you don't use. Don't return thousands of rows to render a small page.
- Check ORM defaults: Auto-generated queries can be convenient and expensive at the same time.
- Retest after each change: Even a good-looking fix can shift load elsewhere.
Optimize the query that burns the most resources first. Don't start with the one that annoys the loudest stakeholder.
For NoSQL systems, the same principle applies in a different shape. If a document design forces repeated lookups for commonly accessed related data, embedding or restructuring may outperform scattered fetches. The pattern changes, but the leadership question stays the same: are we asking the database for data in the most direct way possible?
Tuning the Engine Server Configuration and Caching
Once queries are cleaned up, the next layer is the database engine itself. Within the engine, memory settings, connection behavior, and caching strategy can either support the workload or work against it.
Memory settings that influence speed
Think of memory as the short-order kitchen. If frequently used data stays there, the database serves requests quickly. If it has to keep going back to disk, everything slows down.
There are a few practical rules of thumb worth knowing. For dedicated database servers, MySQL guidance recommends setting the InnoDB buffer pool to 60–80% of server RAM, while PostgreSQL guidance recommends shared_buffers at 25% of RAM, with changes confirmed by restart and buffer hit ratio monitoring (database tuning guide for server memory settings).
That doesn't mean leaders should start editing configs themselves. It means you should ask the team whether the server is sized so the working set can stay in memory, and whether they've verified the effect after changes rather than assuming the setting helped.
Where configuration usually goes wrong
A lot of companies jump from “the app is slow” to “we need a bigger server.” Sometimes they do. Often they just have an undersized cache, poor connection handling, or a workload pattern that overwhelms disk because hot data doesn't stay resident long enough.
Watch for these conversations:
- Too many connections: More isn't always better. Excessive concurrency can increase contention rather than throughput.
- Poor cache fit: If frequently accessed data isn't served from memory, latency becomes inconsistent.
- Competing workloads: Analytics jobs, exports, backups, and transactional traffic can interfere with one another.
- Disk-heavy read patterns: Repeatedly fetching the same information from the database is expensive when caching could absorb the load.
Caching as pressure relief
Caching works because many applications ask the same questions again and again. Product details, user preferences, pricing snapshots, permissions, and read-heavy dashboards are all candidates.
A practical architecture usually combines:
- Database memory caching: The engine keeps active pages available in RAM.
- Application caching: Frequently requested objects are stored above the database layer.
- Distributed caching tools: Systems like Redis can shield the database from repetitive reads when used carefully.
If your software team is sorting out cache design in a Node environment, this breakdown of caching in Node.js gives a useful overview of where application-level caching fits.
A bigger database server won't rescue a noisy application. Good caching and sane configuration often do more than raw hardware spend.
The trade-off is freshness. Cached data can become stale if invalidation is sloppy. That's why leaders should ask two questions together: what should be cached, and how will the team know when that cached data is no longer safe to serve?
Scaling for the Future AI-Powered Modernization
Database performance tuning becomes more strategic as the business grows. The question shifts from “why is this page slow?” to “can this platform support more customers, more data, and more intelligence without becoming fragile?”

Growth changes the shape of the problem
A smaller app can brute-force its way through mediocre data design for a while. A growing app can't. As order history expands, event streams accumulate, and AI features demand more context, inefficient data access becomes more visible and more expensive.
One scaling technique that matters a lot for growing operational systems is partitioning. Large tables partitioned by date range, such as logs, events, or orders, can perform better because the database can work with smaller segments instead of scanning a giant table, which improves performance and scalability for continuously growing datasets (partitioning guidance for large tables).
That matters to the CEO because growth creates data gravity. Historical records keep piling up, but not every query should pay the cost of traversing all history every time.
The AI layer is only as fast as the data layer
Many modernization projects often wobble. Leaders approve an AI assistant, recommendation engine, or context-aware support workflow, but the team treats the database as a separate concern. It isn't separate.
AI features often need:
- customer profile context
- transaction history
- product or content metadata
- permissions and tenancy rules
- logs for audit, tracing, and cost visibility
If those lookups are slow or inconsistent, the AI feature feels slow or inconsistent. The user won't care whether the delay came from model inference or database retrieval. They'll just decide the product is awkward.
A practical modernization plan should consider the database and AI path together. That includes retrieval patterns, caching strategy, logging, and governance around the prompts and parameters that drive AI output.
What scalable modernization looks like
A mature approach usually includes a few architectural habits:
| Priority | Why leadership should care |
|---|---|
| Read-heavy separation | Keeps operational writes from being buried under reporting or retrieval traffic |
| Partition-aware data design | Prevents large historical tables from degrading everyday performance |
| Observability across app, database, and AI flows | Helps teams locate the real bottleneck instead of guessing |
| Governed AI administration | Reduces risk when prompts, parameters, usage, and costs evolve over time |
If your team is weighing engine decisions while planning long-term growth, this comparison of Oracle vs PostgreSQL is a useful strategic read because database choice influences tuning options, operational complexity, and future flexibility.
The database isn't backstage infrastructure anymore. In AI-enabled products, it becomes part of the user experience.
That's the main executive takeaway. Companies that modernize the interface without modernizing the data layer often end up with flashy demos and disappointing daily use. Companies that fix the foundation first usually get AI features that feel faster, safer, and easier to expand.
Your Database Performance Tuning Checklist
Leaders don't need to know every execution-plan detail. They do need a sharp checklist for steering the conversation. Good database performance tuning is less about heroics and more about operating discipline.
One classic warning from Oracle documentation compares missing operating system, database, and application statistics to “missing evidence at a crime scene,” and it also notes that the top ten most common mistakes are often the likeliest sources of performance trouble (Oracle documentation summary via IBM-hosted PDF). That's a useful mindset for executive reviews. Don't start with exotic theories. Start with evidence and common failures.
Phase 1 Diagnosis and baselining
- Define the slow experience in business terms: Which user actions matter most when they lag?
- Ask for a reproducible baseline: The team should show current latency, throughput, and system behavior under controlled conditions.
- Verify instrumentation exists end to end: Application, database, and operating system metrics all need to be visible.
- Check whether one change at a time is the operating rule: If not, results will be hard to trust.
Phase 2 Quick wins in queries and indexes
- Review the heaviest queries first: Don't spread effort evenly across low-impact work.
- Ask whether ORM behavior is creating excess round trips: N+1 patterns and weak eager loading can dominate.
- Inspect actual execution behavior: Plans, scans, joins, sorts, and filters should be reviewed with production-like data.
- Challenge oversized result sets: Teams often fetch more rows and columns than the feature needs.
Phase 3 Infrastructure and configuration
- Confirm database memory settings fit the workload: The team should explain what stays in memory and what spills to disk.
- Review connection strategy: Too many active sessions can create contention rather than speed.
- Separate workloads where needed: Batch jobs, reporting, and transactional traffic shouldn't interfere blindly.
- Use caching deliberately: The team should explain what is cached and how freshness is protected.
Phase 4 Strategic scaling
- Plan for data growth before pain shows up: Large, ever-growing tables need structure.
- Ask whether AI features depend on fast contextual retrieval: If yes, database design is part of AI quality.
- Look for observability across the whole request path: App, database, and AI traces should connect.
- Treat performance as an ongoing operating rhythm: Tuning isn't a one-time cleanup.
A CEO doesn't need to micromanage this work. But you should insist on a system. Fast, scalable software comes from repeatable engineering habits, not wishful thinking.
Wonderment Apps helps organizations modernize software for AI without losing control of the systems underneath it. If you're planning new AI features or upgrading a legacy platform, their team can help you build a stronger foundation and operational layer around it. That includes an administrative tool for AI integration with a prompt vault with versioning, a parameter manager for internal database access, a logging system across integrated AI services, and a cost manager that gives entrepreneurs visibility into cumulative spend. Explore Wonderment Apps if you want a partner that can connect scalable product engineering, AI modernization, and the performance discipline those initiatives depend on.