

Your checkout dashboard is calm at 10 AM, then a release lands and failed payments suddenly climb. In a fintech app, a quiet overnight graph can hide a burst of tiny transactions. In an AI product, the warning might be a prompt-cost spike, a latency jump, or a cluster of malformed responses. By the time someone notices manually, customers may already be feeling the damage.
Anomaly detection techniques help teams find behavior that doesn't fit the current baseline. The difficult part isn't choosing a fashionable model. It's deciding what “normal” means, which alerts deserve attention, and how the system should respond when normal changes.
This guide moves from a simple mental model to production deployment. You don't need a PhD to follow it. You do need a clear business outcome, usable event data, and a willingness to treat detection as an operating capability rather than a notebook experiment. The same thinking can help a payments team reduce a high chargeback rate, protect an ecommerce funnel, monitor industrial sensors, or control AI spending.
When the Numbers Suddenly Look Wrong
A product manager opens the morning dashboard and sees checkout failures climbing. The engineering team checks the payment provider, the database, and the latest deployment. Nothing looks obviously broken. Then an analyst notices that the failures cluster around a new device fingerprint and a narrow traffic window. What looked like random noise may be abuse, a compatibility problem, or a bad release.
In another company, a fintech dashboard shows a burst of micro-transactions during the early morning. Each event is small enough to avoid a simple transaction-value rule. Together, the sequence looks unusual. A detector that examines only individual events misses the pattern, while a detector that understands timing and customer context can raise a useful investigation.
Practical rule: An alert is valuable only when a person can connect it to a decision.
Anomaly detection is the mechanism for finding behavior that departs from an expected baseline. It isn't a guarantee that every alert represents fraud or failure. It narrows a large stream of events into a smaller set of observations worth checking, then gives your team evidence for deciding what to do.
The strongest systems combine a fast first-pass detector with richer context, clear ownership, and feedback from analysts. They also account for the operational layer around AI. A prompt management system can provide the version history, request logs, access parameters, and cost data that make AI-related anomalies observable instead of mysterious.
The rest of this guide covers six practical technique areas, the metrics that matter more than raw accuracy, and a decision framework for starting small. You'll see statistical tests, classical machine learning, deep models, time-series methods, feature design, drift controls, and a concrete way to connect them to a modern application.
What Counts as an Anomaly and Why It Matters
Start with the event, not the algorithm. A point anomaly is a single observation that stands apart, such as an unusually large order among otherwise ordinary purchases. A contextual anomaly depends on circumstances. A coffee purchase may be ordinary on a weekday, but the same event could deserve review when it appears at an unusual time on a card with no available budget. A collective anomaly is a sequence whose members look harmless individually, such as a slow stream of micro-transactions over a period.
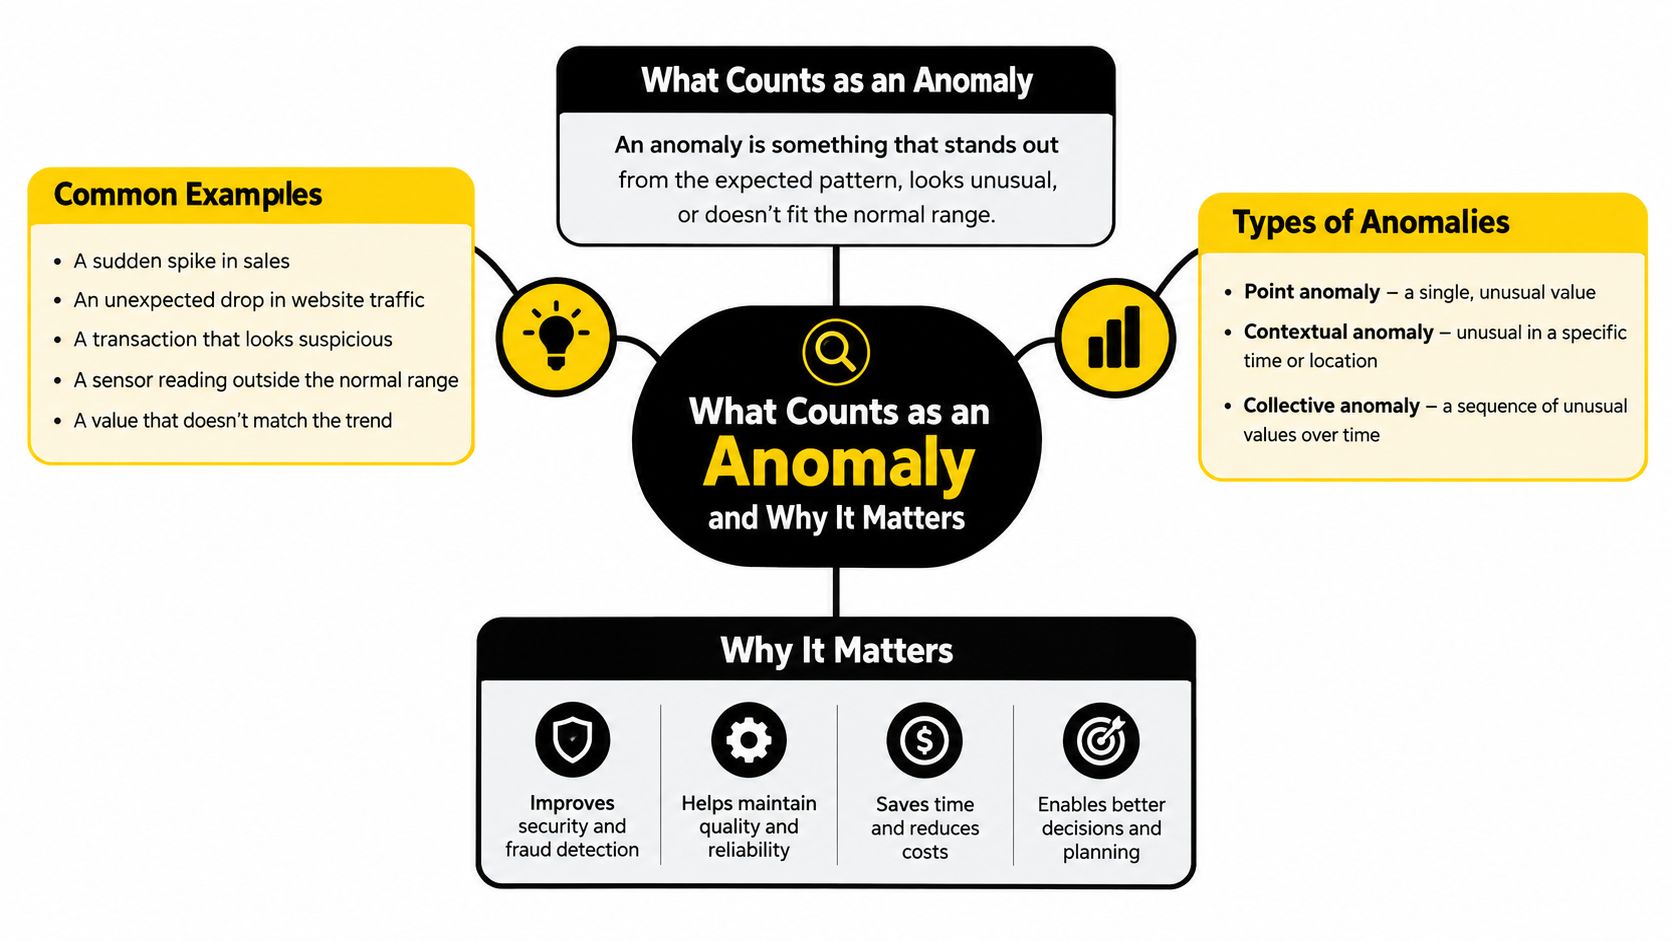
A detector isn't the same as a classifier. A classifier learns known categories from labeled examples, such as confirmed fraud and legitimate payments. Anomaly detection searches for observations that don't resemble the prevailing pattern, including problems your team hasn't labeled yet. It also isn't the same as noise removal. Noise is unwanted measurement variation, while an anomaly may be the most important event in the stream.
Choose the learning setting
The training setup determines what the system can learn:
- Supervised detection uses labeled normal and abnormal examples. It can work well when investigators have consistently classified past incidents, but labels are often incomplete or delayed.
- Unsupervised detection learns structure without requiring an anomaly label for every event. Many teams start here because real incidents are rare, changing, and difficult to define in advance.
- Semi-supervised detection learns mostly from normal data with limited labeled guidance. This can help when confirmed failures exist but don't represent the full range of unusual behavior.
The statistical roots are older and more disciplined than the phrase “AI anomaly detection” suggests. NIST's guidance on outlier tests describes Grubbs' test for one suspected outlier, Tietjen–Moore for multiple suspected outliers, and generalized ESD when the exact number is unknown. The underlying idea is hypothesis testing: assume observations come from a normal population, measure how extreme one is, and decide whether the evidence is strong enough to reject that assumption.
That last step matters. An extreme value isn't automatically an error, attack, or fraud event. A legitimate sale, a medical measurement, or a sudden workload change can look unusual. Good systems screen candidates, test their significance, and attach context before asking a human to act.
The Main Families of Anomaly Detection Techniques
The main families differ in what they assume about the data. Statistical methods usually provide the clearest explanation. Classical machine learning handles richer feature combinations. Deep learning can represent complex, high-dimensional patterns, but it asks more from your data pipeline and validation process.
For a broader discussion of model selection, see Wonderment's guide to anomaly detection models. The useful question isn't “Which model wins?” It's “Which model produces trustworthy decisions at the speed and scale this product needs?”
Statistical methods
A Z-score measures distance from a mean in standard-deviation units. A modified Z-score uses the median and median absolute deviation, or MAD, which can be more stable when extreme values distort the mean. Grubbs' test and generalized ESD provide formal hypothesis-testing routes when your assumptions and suspected outlier count are clear.
These methods suit compliance reporting, operational thresholds, and simple metrics where an investigator needs to understand why an event was flagged. Their weakness is equally clear: a global mean and spread can become misleading when the data has seasonality, multiple operating regimes, or heavy skew.
Classical machine learning
Isolation Forest isolates observations through random partitions, making unusual points easier to separate. It works well as a fast triage layer for tabular features such as transaction velocity, account age, device changes, and order value.
One-Class SVM learns a boundary around the normal class. Local Outlier Factor compares local density, which can help when an observation is unusual relative to its nearby peers rather than the entire dataset. These models handle multivariate structure better than a single threshold, but they still depend on feature quality, scaling, and a stable enough baseline.
Deep learning
Autoencoders learn to reconstruct normal inputs and use reconstruction error as a signal. They fit high-dimensional sensor streams, logs, and application telemetry where a simple distance measure loses relationships among variables. Variational autoencoders add a probabilistic representation, while GAN-based systems can model complex distributions or help with missing data.
Their costs include harder explanations, more sensitive validation, and the risk that the model learns contaminated “normal” data. A deep model can produce impressive benchmark results while creating an alert queue nobody trusts.
| Family | Data Need | Interpretability | Best Fit | Main Weakness |
|---|---|---|---|---|
| Statistical tests | A defined baseline and distribution assumptions | High | Explainable thresholds and compliance reporting | Struggles with complex context and regime changes |
| Classical machine learning | Engineered tabular or behavioral features | Medium | Fast triage across transactions and telemetry | Sensitive to feature quality and baseline selection |
| Deep learning | Larger, structured datasets and careful validation | Lower | High-dimensional streams and correlated sensors | More difficult governance and failure analysis |
A sound production design often combines a fast unsupervised detector with a slower, more accurate model. The first layer can prioritize events, while the second adds context before escalation. Choosing one technique and shipping it without feedback is usually less reliable than using complementary detectors with clear operating boundaries.
Time Series Anomaly Detection in Practice
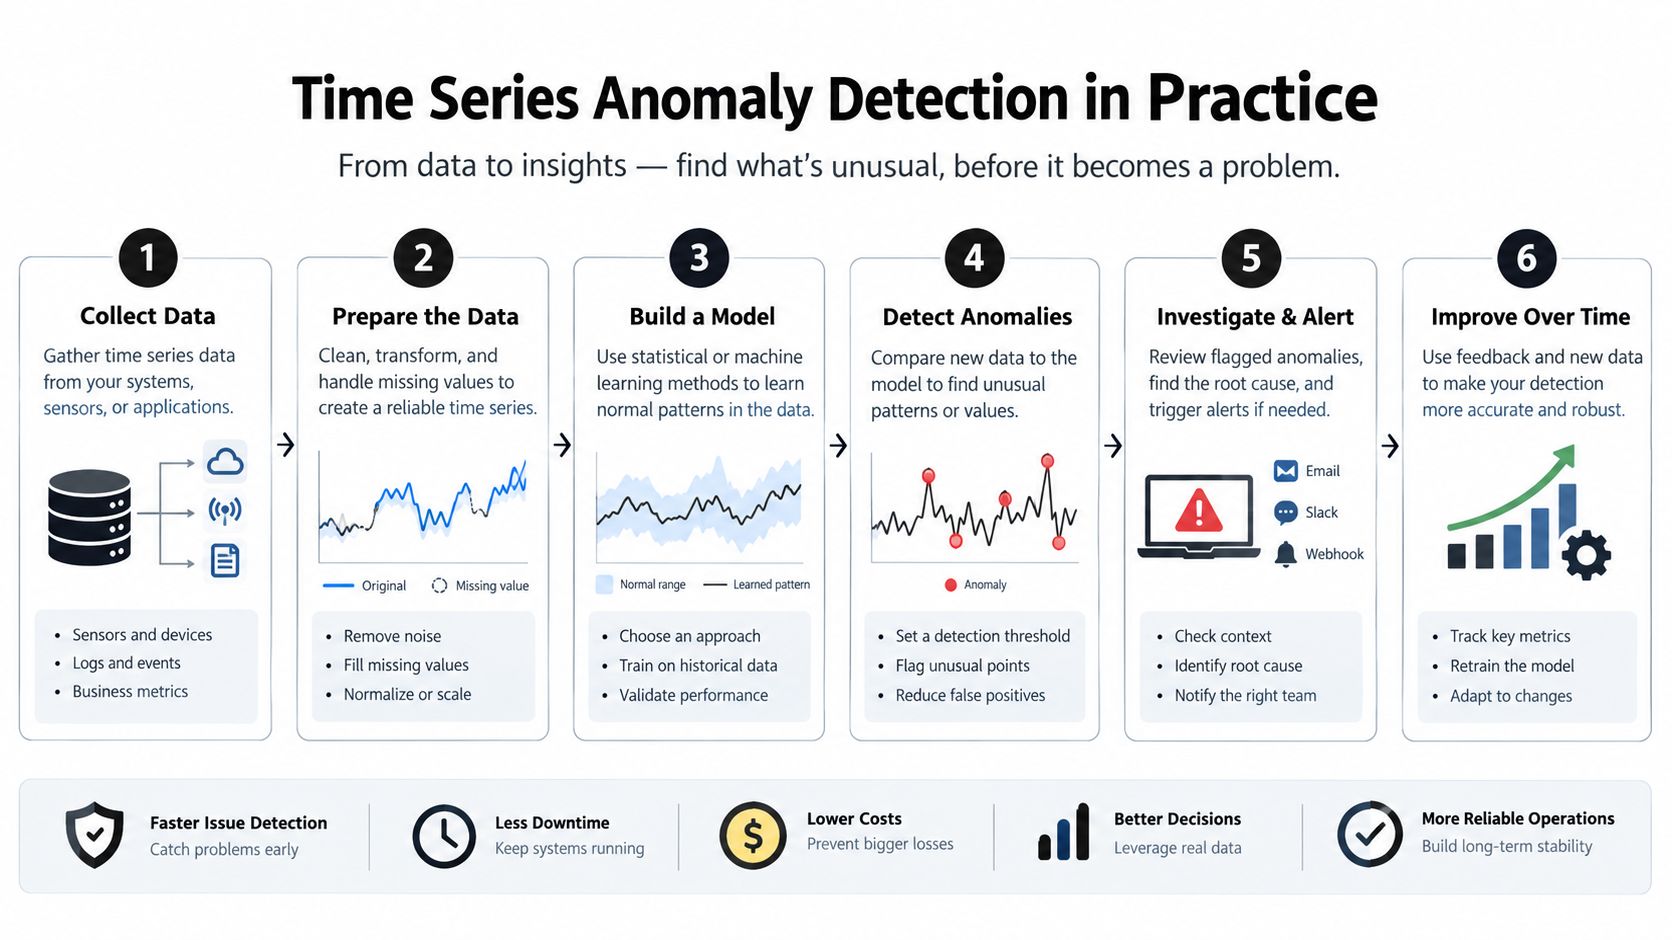
Time series adds a question that point detection can't answer: is this value unusual for this moment? A metric can be high every Monday and still be normal. A steady upward trend can make a fixed threshold generate alerts forever. Seasonality, trend, delayed effects, and missing observations all change the meaning of an individual point.
Rolling statistics create a moving baseline. A rolling mean and spread can identify a recent departure without comparing today's value with an outdated historical average. STL decomposition separates trend, seasonal behavior, and residual movement. Forecasting methods such as ARIMA residuals and Prophet compare the observed value with an expected future value, then score the error.
Deep models offer additional options. LSTM-based forecasters learn sequential dependencies, Temporal Convolutional Networks capture patterns through convolutions across time, and reconstruction-based autoencoders learn the shape of normal windows rather than predicting one value at a time. Each approach needs validation that reflects how the system will operate after launch.
Follow the event, not just the point
Consider an ecommerce checkout funnel. Conversion may decline only for sessions that combine a new device fingerprint, a particular payment route, and repeated retries. A point detector watching total conversion can miss the segment. A contextual detector can compare the segment with its own baseline, while a collective detector can recognize the sequence of retries and failures.
The same principle applies to prompt telemetry. A single expensive AI request may be legitimate. A sustained rise in prompt length, retries, and model routing cost for one tenant is a different operational problem. Wonderment's time-series anomaly detection guidance provides a useful frame for treating the stream as behavior over time rather than a bag of unrelated values.
For industrial time-series data, reconstruction-based deep models are generally the strongest starting point, according to a benchmark study of deep unsupervised methods on the Tennessee Eastman Process data. The evaluation should use F1-score and AUPRC together, because rare anomaly classes can make accuracy look healthy while false positives remain excessive. Regime-specific baselines, temporally separated validation data, and event-level evaluation are essential because sensor drift and operating changes can raise reconstruction error during normal operation.
Features and Evaluation Metrics That Actually Matter
A model can't rescue weak event design. For transaction data, useful features may include ratios between order value and account history, event velocity, time since the previous event, changes in device identity, and rolling deviations from a customer or tenant baseline. A raw amount says little by itself. The combination of amount, timing, location, and recent behavior can reveal the pattern.
Telemetry needs a different vocabulary. Log token counts, co-occurring error codes, request duration, missing feature indicators, model route, prompt cost per request, and retry count can turn an opaque AI call into measurable behavior. Keep the event timestamp, entity identifier, detector version, and feature availability with the score. Otherwise, an analyst may see an alert without knowing whether the detector had a complete view of the event.

Translate metrics into operational language
- Precision asks, “When an alert fires, how often is there a genuine problem?” Low precision creates investigation fatigue.
- Recall asks, “Of the actual problems, how many did we catch?” Low recall leaves incidents invisible.
- F1-score balances precision and recall into one measure, but it shouldn't replace the separate values.
- AUPRC summarizes the precision and recall trade-off across thresholds. It's especially useful when anomalies are rare.
- Detection delay measures how long the system takes to identify an event after it begins. A correct alert that arrives too late may have little operational value.
Cybersecurity benchmarks show why accuracy can mislead. One study reports accuracy above 99% and false-positive rates below 1% on the KDDCup99 and NSL-KDD intrusion datasets, while the more difficult UNSW-NB15 dataset had false-positive rates below 8%. Those figures come from the academic survey and benchmark discussion, and they illustrate a general lesson: performance can change materially when the data becomes more complex or realistic.
Measurement rule: If operations leaders ask how many alerts arrived overnight, the model dashboard must already have an answer.
Log alert rate per unit time, detection delay, stability under missing data, and performance by tenant, software release, traffic pattern, or operating regime. Also record analyst outcomes. A dismissed alert can become feedback about threshold quality, data quality, or an unmodeled legitimate behavior.
Deploying Anomaly Detection Without It Drifting Into Uselessness
A detector can be mathematically correct and operationally wrong. Data drift means the distribution of input features changes, such as a new device fleet producing different telemetry. Concept drift means the relationship between those features and the meaning of an anomaly changes. A change in feature distribution doesn't automatically prove that the business definition of risk has changed.
Suppose fintech traffic rises sharply during a major shopping period. A static threshold may interpret legitimate seasonality as an attack. In healthcare, a new device fleet may shift baseline vital readings without indicating a deterioration in patient health. Both examples require more than a model trained on yesterday's observations.
Match the response to the shift
Gradual changes may call for threshold recalibration or adaptive windows. Persistent distribution changes may justify incremental retraining or a new model. A suspicious shift that could represent an attack or instrumentation failure should pause automatic adaptation and require human review.
Streaming drift detectors can monitor changes continuously. Online learning can update a model as trusted data arrives. Ensembles can combine models trained across different time windows, allowing a short-term detector to respond quickly while a longer-term detector preserves context. None of these mechanisms should update blindly. Teams need rules for which data is trusted, when an update is triggered, how degradation is measured, and how to roll back.
Recent literature identifies concept drift as a central deployment failure, noting that changing user behavior, seasonality, and business conditions can progressively invalidate historical distributions. Static thresholds may classify legitimate variation as risk, and adaptation isn't equivalent to retraining on a fixed schedule.
A simpler detector with disciplined drift monitoring, rollback controls, and alert-volume governance can be more dependable than a complex model nobody maintains. Operational teams also need a clear escalation path, and an alert management Freshservice guide can help frame ownership, routing, and response practices.
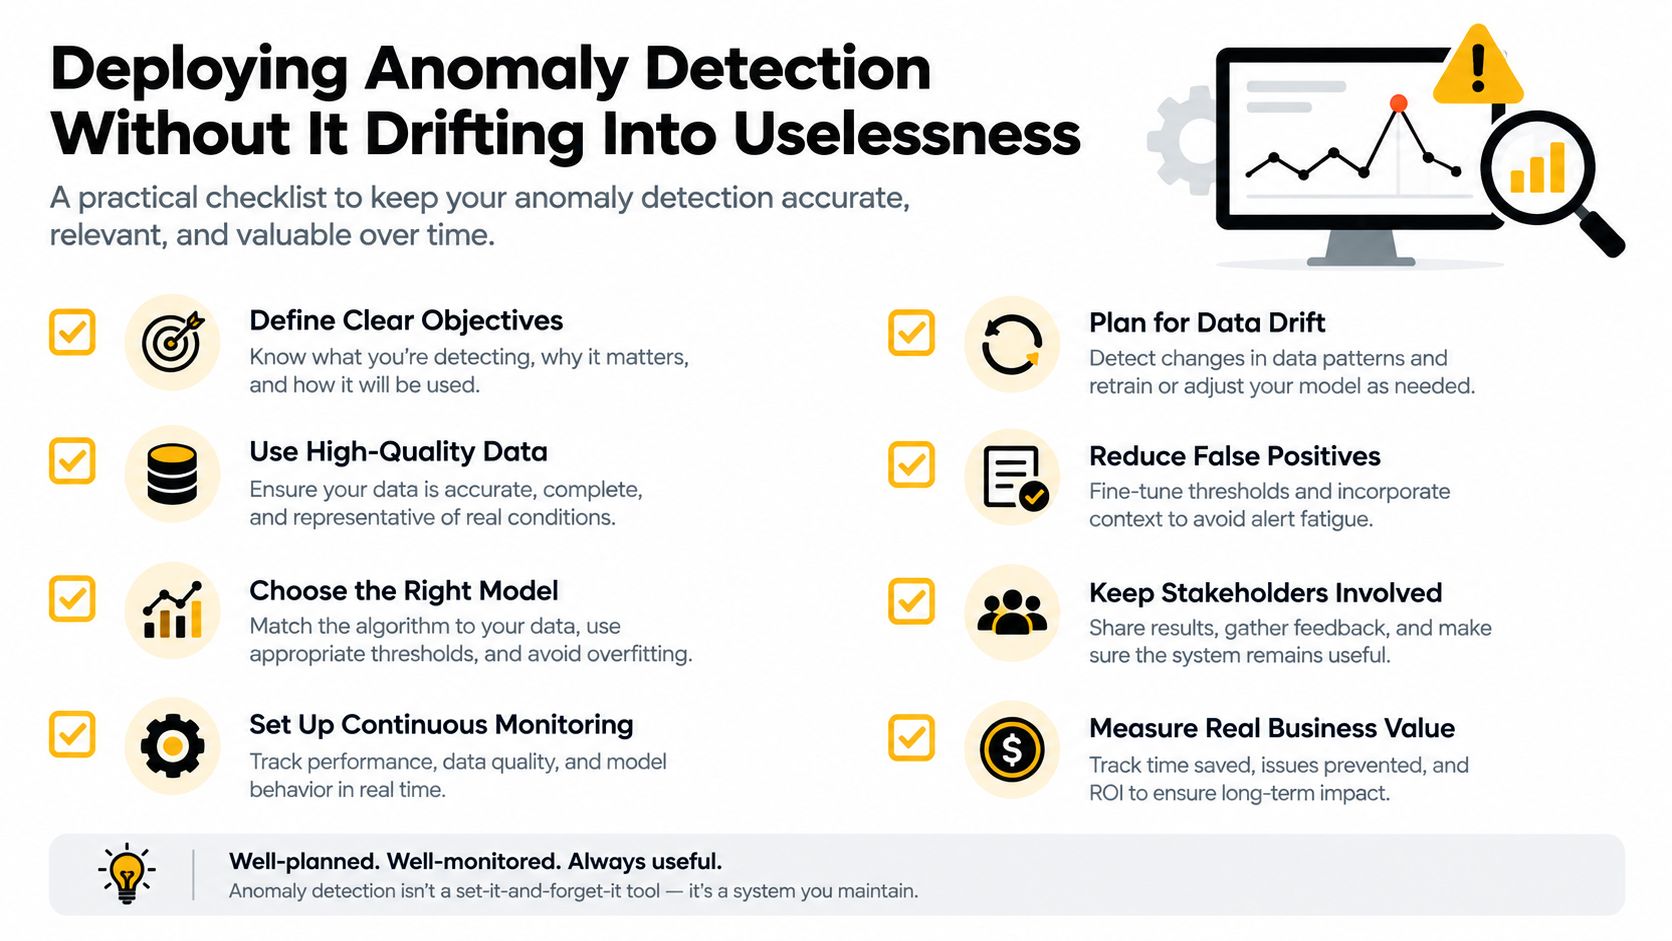
For every event, log the detector version, threshold, feature availability, alert severity, and analyst outcome. Monitor those fields by tenant and traffic regime. That record gives you the evidence to distinguish model failure from a product change, a schema change, or a real shift in customer behavior.
How a Prompt Management System Fits In
AI-native products produce anomaly-shaped signals even when nobody has added an anomaly model. Prompt cost can rise after a template change. A model route can develop sudden latency. An upstream API can change a response schema. A cluster of hallucination reports can appear after a new retrieval source goes live. Malicious or careless inputs can also probe the boundaries of a system's access controls.
The detector needs reliable context for each call. A prompt management system can provide that context as an operational control plane:
- A versioned prompt vault ties each request to the prompt version that generated it. If quality drops after a change, the team can compare versions and roll back deliberately.
- A parameter manager governs database and application parameters exposed to AI workflows. This helps limit uncontrolled access and gives security teams a place to inspect how prompts interact with internal data.
- A cross-model logging system records AI calls across integrated models. It can capture latency, token usage, errors, route, tenant, input metadata, and output validation results, giving anomaly detectors usable features.
- A cost manager surfaces cumulative spend and cost anomalies by tenant, workflow, model, or prompt version. A sudden increase then becomes an investigable event rather than an unpleasant invoice surprise.
This setup changes the engineering problem. Instead of building a detector in isolation, the product team can connect detection to version control, audit trails, access policy, and response workflows. Wonderment Apps offers this type of administrative toolkit for prompt versioning, parameter management, AI logging, and cumulative cost monitoring. A demo is a practical way to inspect how those controls could fit alongside an existing desktop, mobile, web, or SaaS application.
Wonderment's prompt management overview is useful when a team needs to define ownership around prompts and model integrations. The value isn't the word “prompt” by itself. The value is making AI behavior observable enough to test, compare, investigate, and govern.
That operational context also supports personalization and reliability work. If an application adapts recommendations or routes requests between models, anomaly signals can help identify when a change benefits one tenant while harming another. The system can then connect an alert to the relevant prompt, release, model, feature set, and customer segment.
A Practical Starting Point for Your First Detector
Don't begin by searching for the perfect algorithm. Begin with one business failure that an alert can protect against, such as payment abuse, checkout degradation, sensor failure, or uncontrolled AI spend. Define the owner, the response time, and the evidence that will confirm or dismiss the alert.
A small first detector can be enough:
- Log the full event. Capture timestamps, entity identifiers, relevant features, model metadata, missingness, and analyst outcomes.
- Choose one high-value metric. Avoid combining every signal before you understand the baseline.
- Engineer a few meaningful features. Add velocity, time since the previous event, ratios, or a rolling deviation where the business context supports them.
- Start with a rolling Z-score or Isolation Forest. Use the statistical option when explanation matters and the machine-learning option when several tabular features interact.
- Hand-label a week of data. Use those decisions to estimate precision and recall, then inspect false positives instead of hiding them inside a single score.
- Create a response path. Route an alert to a named person, define severity, and record the outcome.
Graduate to a more complex model when high dimensionality makes simple features inadequate, seasonality defeats a fixed baseline, or concept drift changes the operating environment. Consider reconstruction-based deep models for correlated industrial streams, forecasting models for predictable temporal behavior, or ensembles when different time horizons matter.
A managed control plane becomes more relevant when the application uses multiple AI models, needs tenant isolation, requires an audit trail, or must control prompt and model costs. Those needs aren't solved by changing an algorithm. They require consistent logging, versioning, access parameters, and operational ownership.
Before shipping, ask three questions:
- What business outcome does this alert protect?
- Who investigates it at 2 AM?
- How will we know the detector is still working six months from now?
The best anomaly detection techniques are the ones your team can explain, monitor, and improve. Start with a narrow failure mode, measure what happens in production, and add complexity only when the evidence demands it.
Wonderment Apps helps teams modernize web, mobile, desktop, and SaaS products with AI integrations, prompt versioning, model logging, access controls, and cost monitoring that make anomaly detection easier to operate. Visit Wonderment Apps to explore the platform and discuss a practical path from an initial detector to a scalable, governable AI application.