
A lot of teams hit the same moment with React. The product roadmap is healthy, new features keep shipping, traffic grows, and then the app starts to feel heavy. A product list scrolls unevenly. Filters lag. Checkout takes just long enough for users to hesitate. Support hears “it feels slow” long before engineering sees a severity-one incident.
That's why React performance optimization deserves to be treated as product work, not cleanup work. A fast interface helps retention, protects conversion, and gives your engineering team more room to scale features without turning every sprint into a rescue mission. The right approach also reaches beyond the browser. Frontend rendering, data fetching, bundle strategy, server rendering, and monitoring all affect whether the app feels crisp or frustrating.
Your App Is Slow Now What
The first mistake teams make is jumping straight into code changes. They add useMemo, wrap components in React.memo, and hope the lag disappears. Sometimes that works. Often it just makes the codebase harder to reason about while the actual bottleneck stays in place.
A better response starts with triage. Define where the pain shows up, who feels it, and which user journeys matter most. On ecommerce builds, that's usually category pages, search, cart, and checkout. In SaaS products, it's often dashboards, tables, and forms with dense interactions. Slowness in those paths isn't cosmetic. It changes whether users keep moving or abandon the task.
Start with symptoms and business impact
When a React app degrades, the visible symptoms usually cluster around a few patterns:
- Delayed interactions mean a click doesn't feel immediate.
- Jittery updates show up when lists, tabs, or modals repaint too often.
- Heavy initial loads make first impressions worse than the feature set deserves.
- Scaling pain appears when more data or more users expose architectural shortcuts.
The key is to tie each symptom to a business outcome. If product detail pages feel slow, merchandising performance suffers. If dashboards stall, account teams lose confidence in the platform. If a mobile web checkout hangs, users don't wait patiently while React reconciles the tree.
Performance is a feature users notice most when it's missing.
A documented React optimization case study shows how dramatic the upside can be. An application with an initial render time of 21 seconds was reduced to 1.27 seconds through targeted techniques including lazy component loading, minification, code splitting, removal of unused npm packages, server-side rendering, and lazy loading of images. That was a 94% reduction, with a final gzip-compressed bundle size of 157 KB and LCP brought down substantially as part of the process, according to this documented React optimization case study.
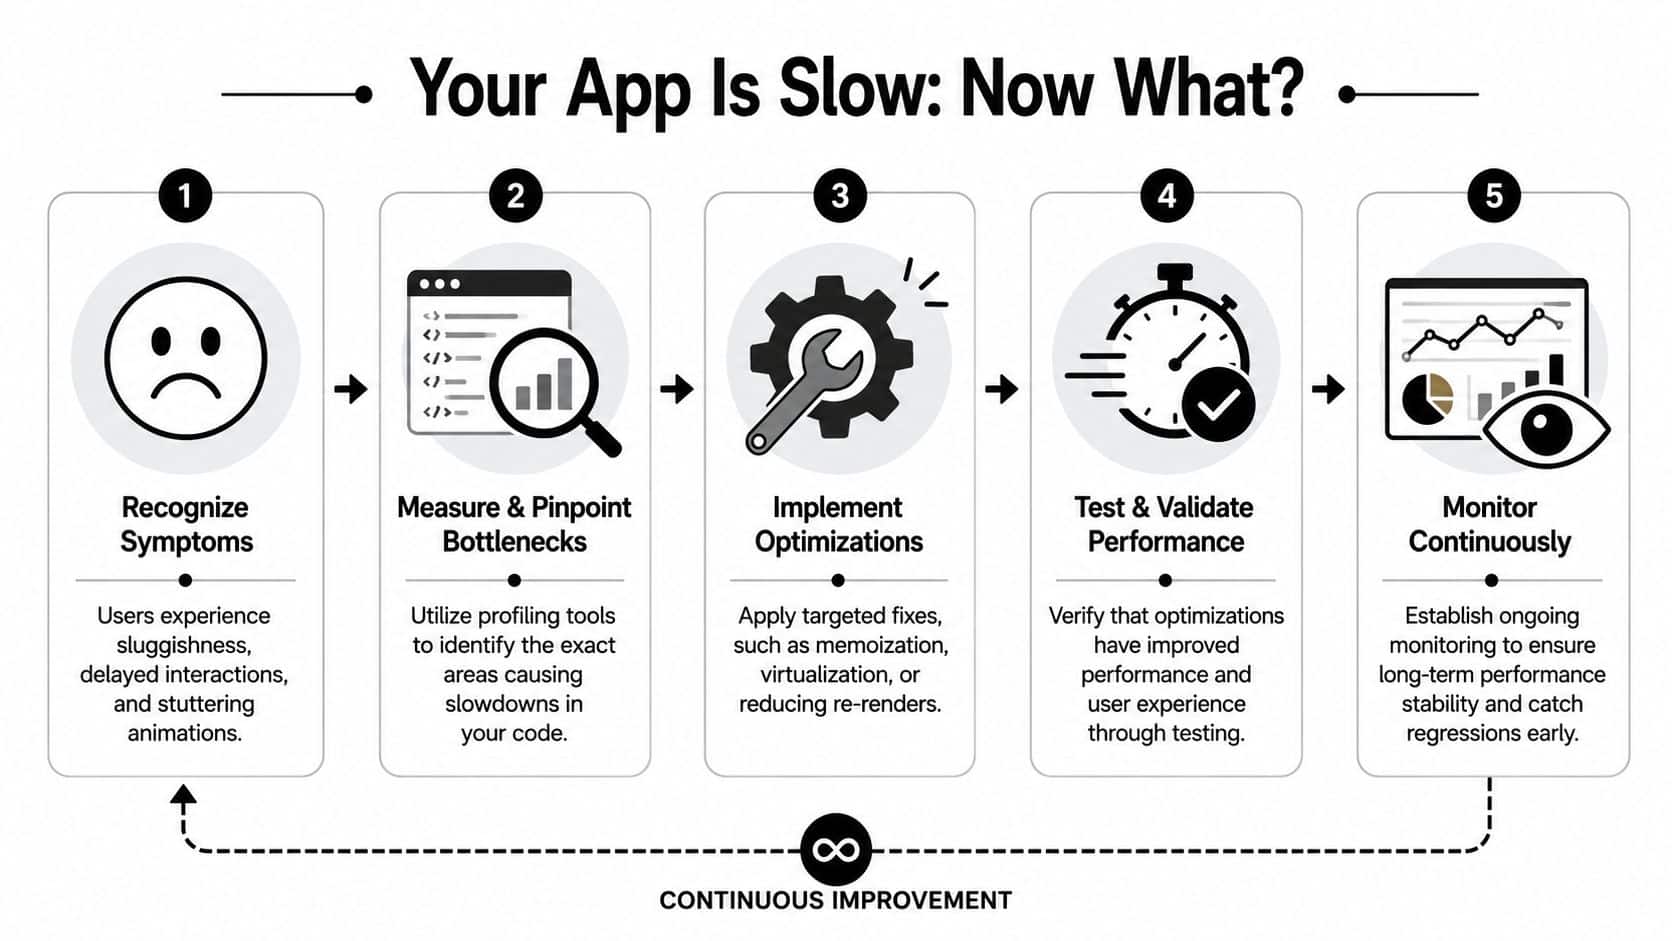
Use a repeatable process
Strong React performance optimization follows a loop:
- Measure first so you know where time is going.
- Pinpoint bottlenecks at the component, network, and rendering levels.
- Apply targeted fixes instead of broad rewrites.
- Validate results against the user flows that matter.
- Keep monitoring so regressions don't sneak back in.
If you're working through broader platform issues, this kind of disciplined workflow pairs well with a more general approach to improving application performance across the stack.
That's the posture to keep throughout this article. Don't treat speed as a one-time repair. Treat it as an operational capability.
Finding the Bottlenecks with Profiling Tools
If you haven't profiled the app yet, you don't know what to optimize. You only know what feels suspicious. Those are not the same thing.

React DevTools first
Open React Developer Tools and start with the Profiler. Record the exact user flow that feels bad. Don't click around randomly. Reproduce one thing at a time, like opening a drawer, typing in a filter field, or switching tabs inside a data-heavy screen.
The profiler helps you answer three practical questions:
- Which components render most often
- Which renders take the longest
- Which parent update triggers too much child work
React's official guidance recommends windowing, also called virtualization, when you render long lists with hundreds or thousands of rows because it only renders the visible subset. The same guidance also notes that the built-in Profiler can log renders exceeding 16 milliseconds, the threshold associated with smooth 60fps animation performance, and that Highlight Updates helps you visually spot frequent renders, as described in this React performance optimization glossary entry.
What usually shows up
In large React apps, uncontrolled re-renders are often the main problem. Experts report that 60-70% of performance bottlenecks in large-scale React applications stem from uncontrolled re-renders due to context updates or prop drilling, and they recommend profiling first to identify and mitigate them, according to DebugBear's guide to measuring React app performance.
That typically appears in one of these forms:
- A broad Context provider updates, and half the screen re-renders for no user-visible reason.
- Prop references change every render because functions or objects are recreated inline.
- Derived values run repeatedly inside hot components instead of being stabilized.
Practical rule: If a tiny interaction causes a large subtree to light up in Highlight Updates, the architecture is probably doing more work than the user action requires.
Then move to Chrome DevTools
React DevTools tells you about component work. Chrome DevTools tells you what the browser is doing with that work. Open the Performance tab, record a session, and watch for long tasks on the main thread. If scripting, layout, or painting expands during simple interactions, the browser is paying for more than React alone.
A few signals matter more than the rest:
| Signal | What it often means | What to inspect next |
|---|---|---|
| Long scripting blocks | Expensive render or data transform work | Hot components and derived computations |
| Frequent layout/paint work | Too many DOM updates or unstable UI structure | Lists, animated regions, large tables |
| Repeated network churn | Duplicate fetches or poor cache behavior | Query lifecycle and request strategy |
When teams want a more disciplined process around this, I usually recommend they standardize tooling, not just debugging habits. A shared stack for performance monitoring tools in software teams prevents every engineer from profiling in a different way and arguing from screenshots.
The goal isn't to create a beautiful flame graph. It's to leave the session with a ranked list of expensive interactions and the components responsible for them.
Winning Quick Victories with Rendering Optimizations
Once profiling shows you where the waste lives, the fastest wins usually come from reducing unnecessary renders. This is the part many teams jump to too early, but once you have evidence, it's worth doing carefully.
Memoization is useful, not magical
React.memo, useMemo, and useCallback solve different problems. Treating them as interchangeable is how teams end up with verbose code and little improvement.
Here's a common issue:
function ProductGrid({ products, onSelect }) {
  return products.map(product => (
    <ProductCard
      key={product.id}
      product={product}
      onSelect={() => onSelect(product.id)}
    />
  ));
}
That inline function creates a new reference on every render. If ProductCard is memoized, that changed prop can still force work.
A cleaner version separates the concerns:
const ProductCard = React.memo(function ProductCard({ product, onSelect }) {
  return <button onClick={() => onSelect(product.id)}>{product.name}</button>;
});

function ProductGrid({ products, onSelect }) {
  const handleSelect = useCallback((id) => {
    onSelect(id);
  }, [onSelect]);

  return products.map(product => (
    <ProductCard
      key={product.id}
      product={product}
      onSelect={handleSelect}
    />
  ));
}
This doesn't guarantee a speedup. It gives React a better chance to skip work when props are stable and the child component is expensive enough to justify memoization.
Keep state close to where it's used
A lot of render churn comes from state living too high in the tree. Teams often centralize state for convenience, then wonder why a local interaction refreshes unrelated UI.
Better patterns include:
- Localize transient state for hover, open/close, focused item, and form draft values.
- Split large Context providers into smaller domains so one update doesn't fan out everywhere.
- Memoize expensive derived values only when the derivation itself is costly or passed into memoized children.
If state changes frequently and only one branch needs it, lifting it higher usually hurts more than it helps.
Use the right tool for the right case
Here's a compact decision guide that keeps React performance optimization practical.
| Technique | Use Case | Common Pitfall |
|---|---|---|
React.memo |
Expensive child component with stable props | Wrapping tiny components that are cheap to render |
useMemo |
Expensive computed value reused across renders | Memoizing trivial calculations |
useCallback |
Stable function reference for memoized children | Adding it everywhere and increasing complexity |
One caution matters here. Memoization doesn't fix bad data flow. If a provider pushes updates across the app or a parent recreates half its props each render, adding hooks at the leaves won't solve the root cause. In those cases, state colocation and context splitting produce cleaner gains than hook-heavy patchwork.
Quick victories matter because they build momentum. But when large datasets, network chatter, or oversized bundles are involved, you need bigger levers.
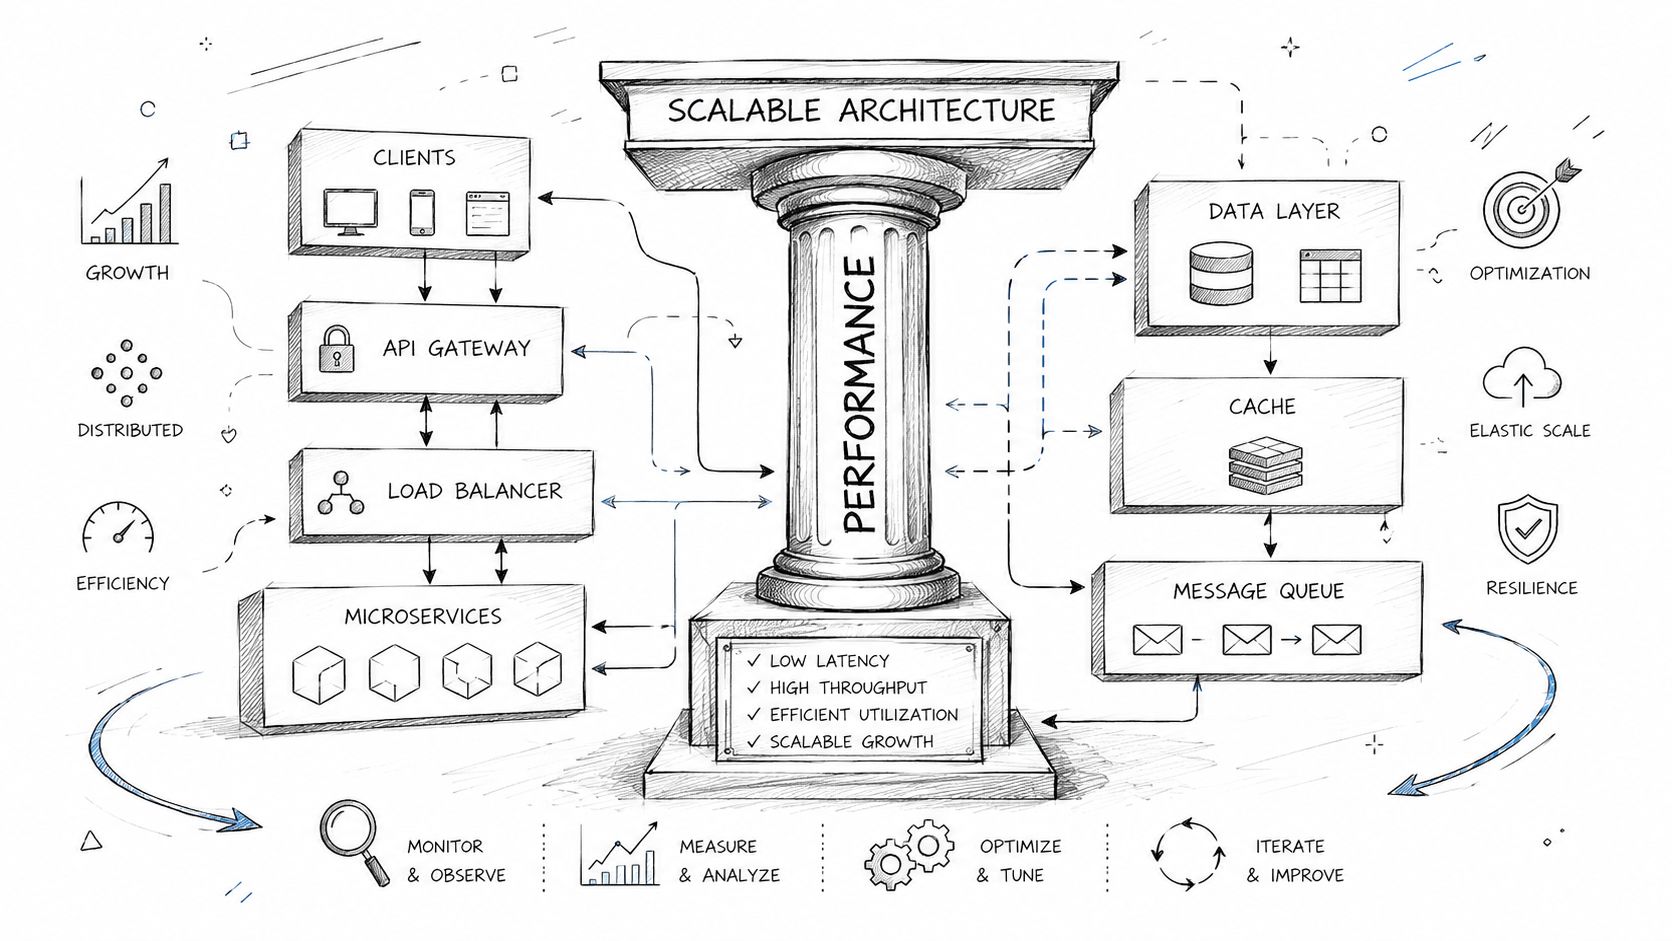
Scaling Performance with Architectural Changes
Some React apps aren't slow because one component is sloppy. They're slow because the architecture asks the browser to do too much. That's when component-level tweaks stop moving the needle.
Shrink the initial load with code splitting
If users land on one route but download code for many routes, the app pays the cost upfront for features they may never visit. Code splitting fixes that by loading only what the current view needs.
A standard pattern looks like this:
import React, { Suspense, lazy } from 'react';

const AnalyticsPage = lazy(() => import('./AnalyticsPage'));

function AppRoutes() {
  return (
    <Suspense fallback={<div>Loading...</div>}>
      <AnalyticsPage />
    </Suspense>
  );
}
This matters most when your application has distinct areas like admin, catalog, support, reporting, or onboarding. Those sections often don't need to travel together in the first bundle.
Use this when:
- a route contains heavyweight charts, editors, or settings UI
- authenticated areas differ sharply from public pages
- your bundle grew through normal product expansion and nobody revisited loading boundaries
Make data fetching behave like infrastructure
A surprising number of React apps still treat fetching as a local side effect in each component. That works for prototypes. It creates duplication, race conditions, and inconsistent loading states in production.
Libraries like TanStack Query improve the feel of the app because they centralize request behavior. Caching reduces repeat fetches. Deduplication prevents multiple components from requesting the same resource at once. Background refresh keeps data current without forcing blocking reloads.
That changes the user experience in concrete ways. Lists open faster on repeat visits. Tabs don't flash through loading states every time a user comes back. Navigating between related screens feels connected instead of stateless.
Long lists need virtualization
Teams often underestimate how quickly list rendering becomes expensive. Tables, feeds, search results, order histories, and media catalogs can all create too many DOM nodes if you render everything at once.
For applications displaying over 1,000 items, virtualization techniques show success rates of over 85% in cutting DOM node creation and re-render duration. Combining virtualization with TanStack Query for caching can improve First Contentful Paint by 35% and reduce API latency by 50% in high-traffic apps, according to this analysis of React performance optimization patterns.
A minimal react-window example makes the pattern clear:
import { FixedSizeList as List } from 'react-window';

function Row({ index, style, data }) {
  const item = data[index];
  return <div style={style}>{item.name}</div>;
}

function ProductList({ products }) {
  return (
    <List
      height={600}
      itemCount={products.length}
      itemSize={48}
      width="100%"
      itemData={products}
    >
      {Row}
    </List>
  );
}
Choose architecture based on scale, not trend
Not every app needs every technique. The decision should match the shape of the product.
- Choose code splitting when route-level features have meaningfully different payloads.
- Choose TanStack Query when multiple screens reuse server data or fetch timing is inconsistent.
- Choose virtualization when visible performance drops as data volume grows.
- Combine them when you're building for dense enterprise workflows, content-heavy retail views, or operational dashboards.
Fast apps don't come from one clever hook. They come from reducing work across rendering, data delivery, and screen composition.
React performance optimization becomes full-stack thinking. Frontend fixes matter, but they have to work with the data and delivery model behind them.
Beyond the Client with SSR and Caching
A lot of React advice still assumes the browser should do most of the heavy lifting. That's fine for some products. It's a poor default for content-heavy storefronts, media platforms, and pages where first impression matters more than client-side cleverness.
Why SSR often beats another round of memoization
If your team keeps polishing client rendering while the initial page load still arrives late, you're optimizing after the user has already started waiting. Server-Side Rendering changes that sequence. The browser receives usable HTML earlier, which improves perceived speed before client hydration finishes.
The contrarian point is worth stating plainly. While 70% of optimization guides prioritize client-side techniques, data shows that Server-Side Rendering can reduce initial load time by 45% and improve LCP by 30%, especially for content-heavy applications like ecommerce or media sites, according to LogRocket's guide to React performance optimization.
That doesn't make memoization irrelevant. It means the first question should be architectural. If the page is mostly content or commerce UI, why force the browser to assemble the first meaningful view from scratch?
When SSR is the better first move
SSR tends to win when these conditions are present:
- Public landing or catalog pages need to show useful content immediately.
- SEO matters because search discovery is part of the business model.
- Content density is high and client-side assembly makes first paint feel delayed.
- Core journeys start before interaction, like browsing, reading, searching, or comparing products.
In those environments, frameworks such as Next.js often make the trade-offs manageable. You get server rendering, route-based code loading, and a path to incremental static generation where some pages can be prebuilt and refreshed over time.
Don't ask “Can React render this in the browser?” Ask “Should the browser be responsible for the first meaningful view at all?”
Add caching where it counts
Caching multiplies the value of SSR. Static assets belong behind a CDN. Reusable API responses should avoid repeated work where your platform allows it. Even modest cache discipline changes how stable the app feels under load because fewer requests compete for the same path at the same moment.
If SSR is on the table, teams should think in layers:
| Layer | Purpose |
|---|---|
| Server rendering | Send meaningful HTML early |
| Asset caching | Deliver JavaScript, CSS, and images faster |
| Data caching | Reduce repeated fetch and backend duplication |
For teams evaluating this path, it helps to compare implementation options and trade-offs in a practical guide to React server-side rendering in production systems.
Client-side optimization still matters after this. It just shouldn't always be the first lever you pull.
Making Performance Permanent with Modern Tooling
A fast release is nice. A fast product six months later is harder. That's where process matters more than any single optimization trick.
Guardrails beat heroics
Performance degrades unnoticed. A new dependency lands. A dashboard adds another widget. A reusable component gains just enough complexity to affect a hot path. Nobody notices until users do. Teams avoid that cycle by setting performance budgets and checking them in CI/CD with tools like Lighthouse CI and browser profiling during release validation.
The same operational thinking applies when teams modernize software with AI capabilities. Before integrating AI into custom applications, organizations need a readiness assessment covering technical capabilities, staff readiness, and budget because skipping that step leads to failure, as explained in this AI integration readiness overview. Model choice also has to match the business job, such as NLP for chatbot flows or computer vision for image recognition, rather than relying on generic model selection, as outlined in this enterprise AI app development guide.

Keep the stack manageable
Modern product teams aren't just managing React render paths anymore. They're managing frontend performance, backend responsiveness, AI workflows, prompt behavior, observability, and operating cost. That's why mature delivery teams prefer systems that make these concerns visible and governable rather than hidden in ad hoc scripts and tribal knowledge.
React performance optimization works best when it becomes part of that broader engineering discipline. Measure regularly. Keep changes traceable. Treat speed, scalability, and AI modernization as ongoing product capabilities.
Wonderment Apps helps teams build and modernize high-performance software for web and mobile. If you're improving a React application, planning AI integration, or trying to turn a growing platform into something faster and easier to manage, explore Wonderment Apps to see how their team approaches product engineering, AI modernization, and scalable delivery.