In a retail world this competitive, you can’t afford to run on intuition alone. So, what is business intelligence for retail? It’s the art and science of turning your raw data—everything from sales figures and customer clicks to warehouse inventory levels—into a clear roadmap for growth.
Think of it as the crucial difference between guessing what your customers want and knowing exactly what they’ll buy next. At Wonderment Apps, we specialize in helping businesses make this exact shift by integrating advanced AI into the custom software applications you already use. A key part of this is our unique prompt management system, an administrative tool that plugs into your existing apps to modernize them for AI integration. This approach makes powerful intelligence accessible without forcing you to rip and replace everything, setting the stage for BI to become a core, sustainable capability for your entire team.
Moving From Retail Guesswork To Intelligent Decisions

For too long, retailers have leaned on experience and gut feelings to make mission-critical decisions. While that kind of instinct is valuable, it leaves a lot of room for error and missed opportunities in today's market. Business intelligence (BI) acts as a strategic co-pilot, giving you the tools to navigate the market with confidence and precision.
It’s all about asking smarter questions and getting concrete, data-backed answers. Instead of wondering which promotions kind of worked last quarter, BI can pinpoint exactly which campaigns drove the most repeat purchases from your highest-value customers. This is a fundamental shift from just reacting to market changes to proactively shaping them.
Why BI Is No Longer Optional
The modern retail environment is flooded with data. Every single transaction, website visit, and social media interaction creates a valuable data point. Without the right tools, this flood of information is just overwhelming noise. BI systems help you cut through it all to:
- Spot hidden patterns: Uncover surprising connections between products, customer behaviors, and seasonal trends you'd never see otherwise.
- Sharpen core operations: Make data-driven calls on everything from inventory stocking to marketing spend to squeeze more value out of every dollar.
- Truly understand your customers: Go way beyond basic demographics to grasp what actually motivates their purchasing decisions.
The urgency here is real. The retail analytics market, which is a specialized part of business intelligence, is set to explode from $10.77 billion in 2025 to $13.26 billion in 2026. That’s a staggering 23.1% jump in a single year, signaling a massive industry-wide push to use data for survival and growth.
Business intelligence is the bridge between raw data and profitable action. It’s how leading retailers answer their most critical questions: 'Who are our most valuable customers?' and 'How do we get more of them?'
To make the leap from guesswork to genuinely intelligent decisions, you first have to understand the foundational importance of retail analytics for growth. It’s a non-negotiable part of any serious business modernization effort. For a bigger picture, check out our guide on the essentials of digital transformation for retail.
Core BI Plays That Drive Retail Profitability
Theory is great, but profitability is better. The real magic of business intelligence for retail happens when you apply it to the high-stakes areas of your day-to-day operations. It's about turning abstract data into concrete actions that directly pad your bottom line.
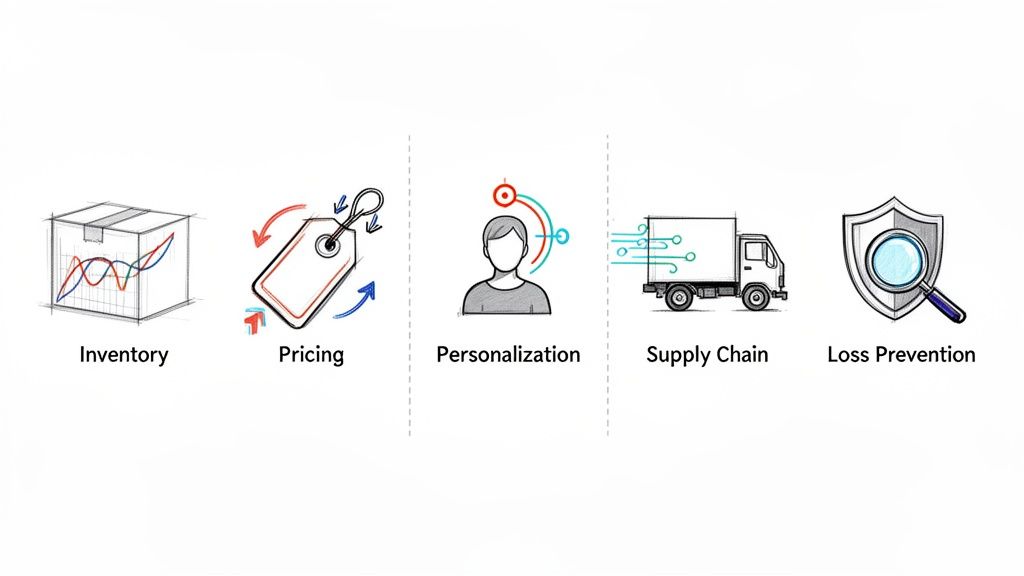
Let's break down five core plays where BI consistently delivers tangible financial results. These aren't just concepts; they are practical, money-making applications that turn data into your most valuable asset.
Smart Inventory Management
Before BI: Your warehouse operates on guesswork. You order extra winter jackets anticipating a cold season, but a mild winter leaves you with mountains of costly overstock. At the same time, a product goes viral on TikTok and sells out in days, leaving you with empty shelves and frustrated customers who head straight to your competitors.
After BI: Your strategy shifts from reactive to predictive. BI tools dig into historical sales data, crunch weather forecasts, and even monitor social media trends to forecast demand with shocking accuracy. This empowers you to maintain optimal stock levels, freeing up cash that was once tied up in unsold goods while ensuring your bestsellers are always ready for purchase.
The result is a direct hit on carrying costs and a huge jump in captured sales. You’re no longer just guessing what to stock; you’re strategically placing inventory to meet customer demand before it even spikes.
Dynamic Pricing Strategies
Before BI: Your pricing is rigid, likely based on a simple cost-plus model. You set a price for a new shirt and it stays there all season, completely ignoring what your competitors are doing, sudden demand surges, or even a local festival that's driving more foot traffic to your store.
After BI: Pricing becomes agile and intelligent. A BI system can track competitor prices in real-time, spot demand surges for specific items, and factor in external events. It gives you the power to make small, strategic price adjustments that maximize your margin on every single sale.
This might mean dropping a price just enough to beat a competitor or raising it slightly during a peak demand window. Instead of a one-size-fits-all price tag, you’re using data to find the profit sweet spot for every product, every single day.
Genuine Customer Personalization
Before BI: "Personalization" is just adding a customer's first name to a generic email blast. You send the same five product promotions to your entire list, resulting in low engagement, wasted marketing dollars, and customer fatigue.
After BI: You graduate from generic blasts to hyper-targeted conversations. BI segments your audience based on actual purchase history, browsing behavior, and loyalty status.
By understanding what specific customer groups truly want, you can craft offers that feel genuinely personal and relevant. This deepens customer loyalty and significantly boosts campaign conversion rates.
Imagine sending a special offer for new running shoes only to customers who have previously bought athletic gear. That’s the kind of precision that turns one-time shoppers into lifelong brand advocates.
Supply Chain Optimization
Before BI: Your supply chain is a black box. You know products somehow get from the factory to your warehouse, but you have zero visibility into shipping bottlenecks, carrier performance, or other inefficiencies that drive up costs. This leads to unexpected delays and inflated transportation bills.
After BI: You get a crystal-clear, end-to-end view of your entire supply chain. BI dashboards can track shipments in transit, monitor carrier delivery times, and identify the most cost-effective routes.
This visibility allows you to:
- Pinpoint bottlenecks: See exactly where delays are happening over and over.
- Negotiate better rates: Use hard performance data to hold carriers accountable.
- Reduce shipping costs: Optimize routes and find smarter consolidation strategies.
By turning data into a logistical map, you can trim the operational fat and get products on your shelves faster and for less money.
Proactive Loss Prevention
Before BI: You discover theft or fraud long after the damage is done, usually during a manual inventory count or a painful financial audit. By then, the loss has already hit your profits, and figuring out the source is next to impossible.
After BI: Your system acts like a digital watchdog, flagging suspicious patterns in real-time. By analyzing transaction data, BI can spot anomalies that point to potential fraud—like an unusual number of returns from one customer or a cashier processing too many voids. This lets you investigate and step in before small problems balloon into significant financial drains, protecting your revenue from the inside out.
Fueling Your BI Engine With The Right Data and KPIs
A business intelligence system is a lot like a high-performance engine; its output is only as good as the fuel you put into it. For retailers, that fuel is high-quality, relevant data. Without the right inputs, even the most advanced BI platform will just spit out lackluster insights, leaving you with flashy dashboards that don’t actually help you make better decisions.
This is exactly where many BI initiatives get stuck. It’s easy to get caught up in the technology, but the real power comes from a solid data strategy. To build a business intelligence for retail program that truly delivers, you first have to identify and connect the critical data sources that tell the complete story of your business.
Tapping Into Your Core Data Sources
Your business is already a goldmine of information, generating valuable data every single day. The first step is to bring these internal sources together to create a single, unified view of your operations and customers.
Key internal data streams include:
- Point-of-Sale (POS) Systems: This is the ground truth for your stores. Every transaction, product sold, and payment method used is captured right here.
- E-commerce Platforms: Platforms like Shopify or Magento are overflowing with digital behavior data, including clicks, time on page, and cart abandonment rates.
- Customer Relationship Management (CRM) Software: Your CRM holds the keys to customer loyalty, containing purchase history, contact information, and every interaction they’ve had with your brand.
- Inventory Management Systems: This data tells you what you have, where it is, and how fast it’s moving—absolutely essential for any supply chain analysis.
But looking only inward gives you an incomplete picture. To get a real competitive edge, you need to pull in external data to understand what's happening in the broader market. This could be social media trend data to spot the next big thing or competitor pricing data to keep your strategies sharp.
By connecting these diverse streams, you start building a comprehensive data ecosystem. To get a better sense of how this information flows from source to dashboard, it's worth understanding more about applying data pipelines to business intelligence.
Focusing on KPIs That Actually Matter
Once your data is flowing, the next challenge is to cut through the noise. It’s incredibly easy to get lost in a sea of "vanity metrics"—numbers that look impressive on a chart but don’t actually correlate to business health. Actionable BI is all about focusing on a curated set of Key Performance Indicators (KPIs) that act as a real-time health check for your retail operation.
Smart retailers don't track everything; they track the right things. Focusing on a handful of powerful KPIs transforms your BI dashboard from a data dump into a strategic command center for growth.
This table breaks down how your core data sources directly fuel the KPIs that matter most.
Retail BI Data Sources vs. Critical KPIs
| Data Source | Description | Key KPIs It Informs |
|---|---|---|
| Point-of-Sale (POS) | Captures in-store transaction details like items sold, price, time, and payment method. | Average Transaction Value (ATV), Sales per Square Foot, Product Affinity |
| E-commerce Platform | Tracks online user behavior, from clicks and session duration to cart additions and checkouts. | Conversion Rate, Cart Abandonment Rate, Customer Acquisition Cost (CAC) |
| CRM Software | Stores customer profiles, purchase history, loyalty status, and communication logs. | Customer Lifetime Value (CLV), Customer Churn Rate, Repeat Purchase Rate |
| Inventory System | Manages stock levels, product locations, supplier details, and movement across the supply chain. | Inventory Turnover Rate, Stock-to-Sales Ratio, Sell-Through Rate |
| Marketing Analytics | Gathers data from ad platforms and email campaigns on impressions, clicks, and costs. | Return on Ad Spend (ROAS), Customer Acquisition Cost (CAC), Campaign ROI |
As you can see, each piece of data has a purpose, feeding into a bigger picture that helps you run your business smarter. Now, let's look at four of the most critical KPIs every retailer should have on their dashboard.
Here are four essential KPIs every retailer should be tracking:
- Customer Lifetime Value (CLV): This metric predicts the total revenue you can expect from a single customer over their entire relationship with you. It’s a game-changer because it shifts your focus from short-term sales to long-term relationship building, helping you identify and reward your most profitable customers.
- Inventory Turnover Rate: This tells you how many times your inventory is sold and replaced over a specific period. A high turnover rate is a great sign of strong sales and efficient management, while a low rate can signal overstocking or weak demand.
- Average Transaction Value (ATV): Simply put, this is how much a customer spends, on average, every time they check out. Increasing your ATV through smart upselling and cross-selling is one of the quickest ways to boost revenue without having to find new customers.
- Customer Acquisition Cost (CAC): This KPI calculates exactly how much it costs you, on average, to win a new customer. When you compare your CAC to your CLV, you get a crystal-clear picture of whether your growth strategy is profitable and sustainable.
Your Step-By-Step Retail Intelligence Roadmap
Getting started with business intelligence can feel like trying to boil the ocean. You're swimming in data points, potential tools, and projects, and it's easy to get paralyzed by the sheer scale of it all.
The secret? Don't treat it as one massive, monolithic project. Think of it as a methodical journey, taken one step at a time. A phased roadmap demystifies the whole process, turning an overwhelming goal into a series of manageable, value-driven stages.
This approach lets you build momentum, prove the value early on, and sidestep the common traps that derail ambitious data initiatives. By focusing on consistent, measurable wins, you build a sustainable business intelligence for retail capability that grows right alongside your business. And the industry is betting big on this. Retail trade is a heavyweight spender in this arena, set to invest a staggering $2.047 billion on BI solutions in the next 12 months alone. You can dig into the numbers in recent market data on business intelligence spending.
Stage 1: Define Your Business Goals
Forget about software and dashboards for a minute. The very first question you need to ask is simple: "What specific business problem are we trying to solve?" A BI project without a clear goal is just a technical exercise going nowhere. Your objective has to be tangible and measurable.
Are you trying to:
- Chop your e-commerce cart abandonment rate by 15%?
- Improve in-stock accuracy for your top 50 products?
- Boost the average transaction value in your brick-and-mortar stores?
Starting with a well-defined business goal focuses your efforts like a laser and gives you a clear benchmark for what success actually looks like. Honestly, this first step is the most critical one. It anchors your entire BI strategy to real-world business outcomes.
Stage 2: Audit Your Data Landscape
Okay, you have your goal. Now it’s time to take stock of your raw materials: your data. This data audit is all about identifying what information you collect, where it currently lives, and—most importantly—judging its quality and reliability.
You'll need to map out key sources like your POS system, e-commerce platform (Shopify, BigCommerce, etc.), and CRM. Ask the tough questions here. Is the data clean and consistent? Are there frustrating gaps or inaccuracies? Getting a clear picture of your data landscape upfront saves you from massive headaches down the road and ensures your BI engine is fueled with high-quality information.
Stage 3: Choose the Right Tools and Foundation
Only after you’ve defined your goals and audited your data should you even start looking at technology. Sure, there are powerful visualization tools out there like Power BI and Tableau that can make your data sing. But those tools are just the final, visible layer of your BI stack.
This flow shows how data gets from its raw source to the insights you can actually use.
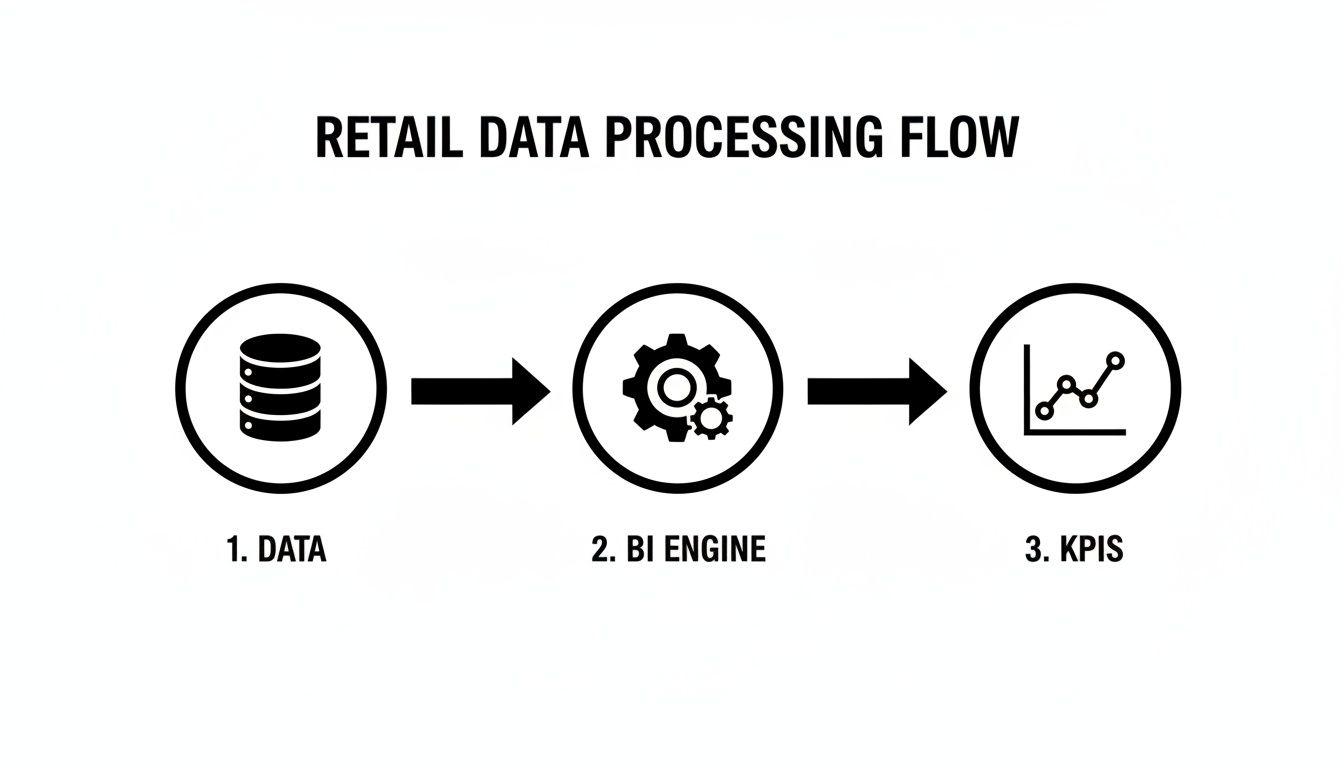
As you can see, powerful KPIs are the direct result of a solid BI engine crunching clean, well-structured data. It's absolutely crucial to build a solid data foundation—often a data warehouse or data lake—that pulls your various data sources into a single source of truth.
A great BI dashboard is only as reliable as the data plumbing beneath it. Investing in a solid foundation is non-negotiable for building a scalable and trustworthy intelligence system.
Stage 4: Launch a Pilot Project
Now it's time for action, but don't try to solve every problem at once. Pick a small, high-impact pilot project that directly tackles the business goal you set back in stage one. This could be something like creating a dashboard to track inventory turnover for a single product category or analyzing the performance of a recent marketing campaign.
A successful pilot accomplishes two things: it scores a tangible business win and builds internal momentum. When other departments see the real-world value BI delivers, getting their buy-in for bigger, more ambitious projects becomes a whole lot easier.
Stage 5: Scale and Govern Your Data
With a win from your pilot project under your belt, you can start to scale your BI capabilities across the organization. This means taking on new business problems, plugging in more data sources, and rolling out dashboards to more teams.
As you grow, data governance becomes absolutely essential. This means setting up clear rules and processes for maintaining data quality, ensuring data security, and defining who gets to see what. Strong governance ensures that as your BI program expands, the insights it produces stay accurate, consistent, and trustworthy.
Modernize Your Tech Stack With AI-Powered BI
Traditional BI is fantastic at showing you what happened yesterday. It can spit out a report detailing last week’s sales or last month's inventory levels. But what if your systems could tell you what’s likely to happen next week and suggest the best way to prepare?
This is the real frontier of business intelligence for retail—making the shift from simply describing what happened to predicting what will happen and prescribing what you should do about it. Artificial intelligence is the engine that powers this leap, turning your existing software into a proactive partner.
This evolution isn’t just a passing trend; it's a market-defining movement. The global BI market, which is heavily driven by retail, was valued at USD 31.34 billion in 2024 and is projected to more than double to USD 63.17 billion by 2034. You can explore more data on the explosive growth of the BI market on Mordor Intelligence.
The Leap From Legacy Systems to Smart Environments
Modernizing your tech stack with AI doesn't mean you have to rip and replace everything you've already built. The smarter approach is to integrate AI capabilities directly into the custom software you already rely on. This is exactly where a partner like Wonderment Apps can guide your transformation.
We've developed a unique prompt management system; it’s an administrative tool that developers and entrepreneurs can plug into their existing app or software to modernize it for AI integration. It’s designed to give business leaders the control and visibility they need to modernize with confidence, turning legacy software into an intelligent, data-driven environment. For a deeper dive, read about the powerful benefits of AI in ecommerce in our related guide.
This tool essentially acts as a central nervous system for your AI, giving you full command over how it interacts with your business data and operations.
The goal of AI integration isn't just to add a new feature; it's to create an intelligent ecosystem where your existing software can predict customer needs, optimize operations, and drive growth automatically.
A Toolkit for Confident AI Integration
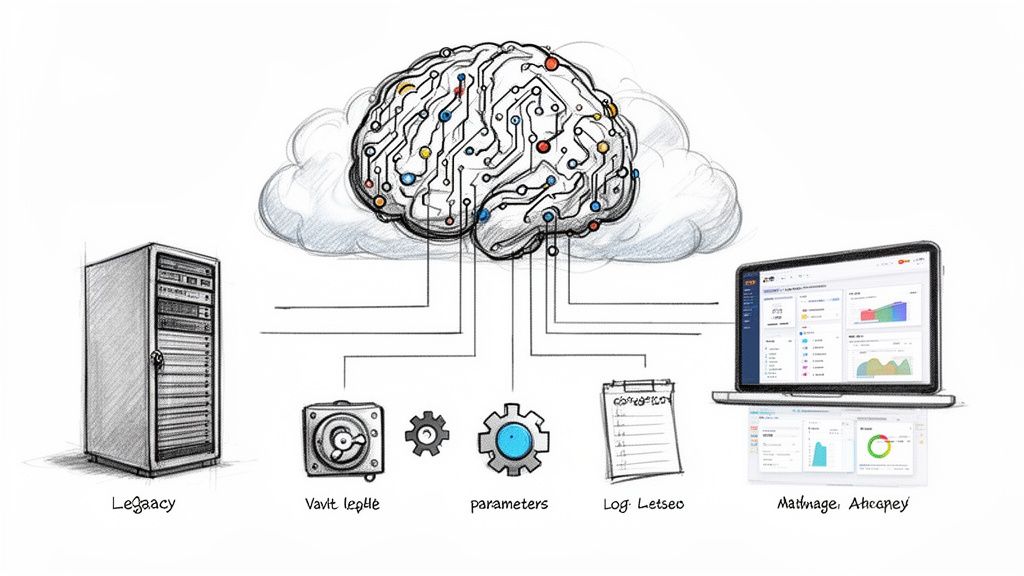
Our administrative tool provides the essential guardrails for deploying AI responsibly and effectively within your retail operations. It’s built around four core features designed to give you complete control.
- Prompt Vault with Versioning: Think of this as a centralized, version-controlled library for all your AI instructions, or "prompts." It allows you to test, refine, and track changes to how you ask the AI to perform tasks—like analyzing customer feedback or generating product descriptions—ensuring you get consistent, high-quality results every time.
- Parameter Manager: For AI to be useful, it needs access to your internal database, but that access must be secure and controlled. The parameter manager is your gatekeeper. It lets you define exactly which data fields and tables the AI can see and use, protecting sensitive information while still enabling powerful analysis.
- Centralized Logging System: This feature keeps a complete, unified record of every interaction across all your integrated AI models. You get a full audit trail for troubleshooting, monitoring performance, and ensuring compliance, giving you a clear view of how AI is being used across your entire organization.
- Cost Manager: Using AI models comes with API costs. Our cost manager provides a transparent dashboard that tracks your cumulative spend across all integrated AIs. This gives you the financial visibility you need to manage budgets effectively, prevent surprise bills, and prove the ROI of your AI initiatives.
Common Questions About Retail Business Intelligence
Stepping into the world of business intelligence always kicks up a few questions. As you start thinking about moving from a basic plan to a full-blown implementation, it's totally normal to wonder where to begin, how this all works for different kinds of stores, and what the payoff really looks like. Let's dig into some of the most frequent questions we hear from retail leaders.
What Is the Best First Step for a Small Retail Business Starting With BI?
The single most important first step is to pick one specific, high-value problem you want to solve. Seriously. Fight the urge to build a massive, all-in-one system right out of the gate. The goal here is to start small and prove the concept's value, fast.
A great starting point? Figure out exactly why your top 10 products are flying off the shelves. You can use the sales data you already have sitting in your POS system and a simple tool like Google Data Studio to start connecting the dots. This kind of "small win" shows everyone the power of business intelligence for retail and gives you a solid launchpad for bigger projects, all without needing a huge upfront investment.
How Is BI for Ecommerce Different From BI for Physical Stores?
While the end goal is the same—selling more and managing inventory better—the core difference is where the data comes from. A smart BI strategy has to be built around these unique data streams.
- Ecommerce BI is all about digital footprints. We're talking clickstream analysis, cart abandonment rates, customer journey mapping, and social media engagement. It's about understanding online behavior.
- Brick-and-Mortar BI leans into physical metrics. This means things like foot traffic patterns, in-store heat maps showing where people linger, sales per square foot, and how long shoppers spend in a particular aisle.
The real magic happens in an omnichannel strategy, where your BI system can pull in both online and offline data. That’s how you get that coveted single view of the customer and finally understand their entire journey with your brand, from a Facebook ad to the checkout counter.
Can BI Actually Create Personalized Customer Experiences?
Absolutely. In fact, this is one of its most powerful—and profitable—applications. When you pull together data from your CRM, sales platform, and loyalty programs, BI can slice and dice your customer base into incredibly specific groups. Think "high-spending recent buyers who only buy a specific brand."
This level of detail lets you launch laser-focused email campaigns, offer up personalized product recommendations, and create special offers that blow generic marketing out of the water. When you layer in AI, BI can even start predicting future purchases, helping you show the right product to the right person at the perfect time.
Modernizing your retail operations with business intelligence and AI isn't just a nice-to-have; it's how you stay competitive. Wonderment Apps specializes in integrating intelligent systems into the software you already use, helping you unlock the insights hidden in your data without having to rip and replace everything.
Ready to turn your data into your most valuable asset? Request a demo to see how our administrative toolkit can help you manage AI integration, control costs, and build for the future.