Turning your website visitors into actual customers isn't about guesswork; it's a science. It all starts with digging into why people are leaving and then methodically knocking down those barriers. This guide is your complete playbook for turning more of those browsers into buyers, showing you how to design and develop excellent app experiences that convert.
Your Starting Point for Higher Conversions
If you want to improve your website's conversion rates, you have to move from making assumptions to taking data-driven action. It’s a structured process: analyze how users behave, find the friction points that are tripping them up, and then systematically test solutions to see what actually works. To really get ahead, integrating AI to modernize your application can give you a massive advantage.
In fact, at Wonderment Apps, we've seen firsthand how a smart, integrated AI strategy can transform a user experience. That’s why we developed a prompt management system—an administrative tool that developers and entrepreneurs can plug into their existing app or software to modernize it for AI integration. This isn't just about chasing trends; it's about building a smarter, more responsive application that meets modern user expectations.
We’ll walk through everything from foundational analytics to deploying advanced, AI-driven strategies that create a truly personal journey for each user. The goal is to pinpoint exactly where users drop off and—more importantly—understand the real reasons they’re bailing.
Modernize Your Approach with AI
To really speed things up, bringing AI into your application isn't a luxury anymore; it's a competitive must-have. For instance, Wonderment Apps' prompt management system helps developers and business leaders weave sophisticated AI features right into their existing software without a massive overhaul.
A smart AI integration is what powers the kind of personalization we'll get into later. This includes tools that let you:
- Manage Prompts: A version-controlled prompt vault ensures your AI's responses are always consistent and on-brand.
- Control Data Access: Use a parameter manager to give the AI secure, controlled access to your internal databases for hyper-personalized content.
- Monitor Spending: A cost manager provides a clear, cumulative view of your AI spend, so there are no nasty budget surprises at the end of the month.
This whole process can be broken down into a core flow: first, you analyze behavior, then you modernize your tech stack with tools like AI, and finally, you convert more visitors into customers.
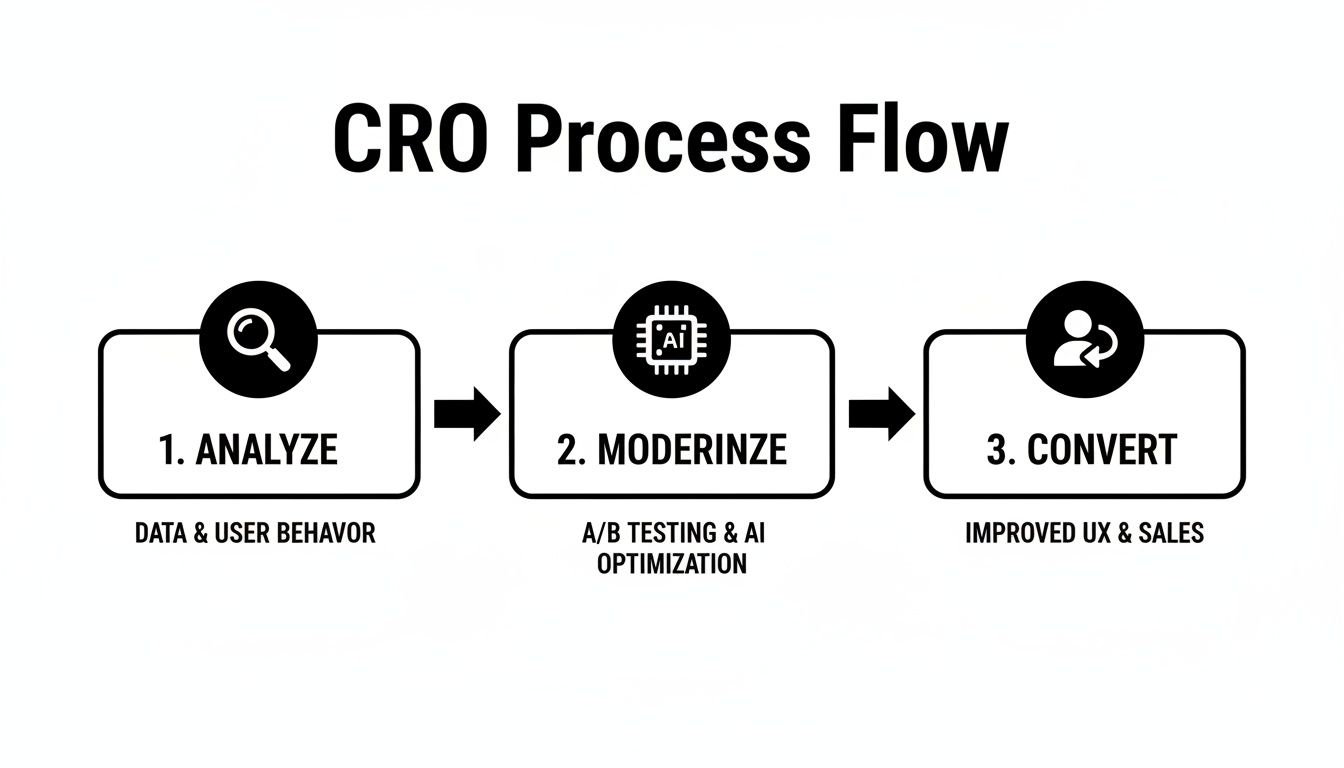
This simple Analyze, Modernize, Convert model gives you a clear framework for turning website traffic into real business results.
A Roadmap for Success
Consider this your roadmap for making smarter, data-backed decisions that turn visitors into loyal customers. This isn't about chasing a single "magic bullet." It’s about building a culture of continuous improvement where you learn to form hypotheses from real user data, implement changes, and measure the impact like a scientist.
To get started on the right foot, exploring essential conversion rate optimization techniques can give your website's performance a significant leg up.
Before we dive in, let’s quickly summarize the core areas you'll need to focus on. These are the foundational pillars of any successful CRO program.
Key Pillars of Conversion Rate Optimization
| Pillar | Objective | Example Tactic |
|---|---|---|
| Analytics & Data | Establish a single source of truth for user behavior. | Set up event tracking in Google Analytics for key actions like button clicks and form submissions. |
| User Experience (UX) | Identify and remove friction in the user journey. | Use heatmaps and session recordings to see where users get stuck or frustrated. |
| Copywriting | Clarify the value proposition and create compelling calls-to-action. | A/B test different headlines on your homepage to see which one resonates most. |
| Testing & Iteration | Validate changes with data, not opinions. | Run controlled A/B tests on your checkout page to improve form completion rates. |
Focusing on these four pillars provides a structured way to approach your CRO efforts, ensuring you’re building on a solid foundation.
The core of conversion rate optimization is simple: make it easier for people to say "yes." By removing obstacles and clarifying your value, you're not just improving a metric; you're creating a better customer experience from the very first click.
In the end, every single improvement—no matter how small it seems—adds up to a stronger bottom line and more sustainable growth. Let's start the journey of transforming your website into a high-performing conversion engine.
Building Your Data-Driven Foundation
You can't fix what you don't measure. Guessing why users leave your site is a surefire way to burn through your budget with nothing to show for it. Before you touch a single line of code or rewrite a single headline, you have to build a solid, data-driven foundation that tells you exactly what’s happening, where, and why.
This means getting past the vanity metrics. Page views are nice, but they don't tell you anything about user intent. The real goal is to map out the entire user journey, pinpointing every action that brings a visitor one step closer to becoming a customer.
Setting Up Meaningful Event Tracking
To get the real story, you need to set up event tracking in an analytics tool like Google Analytics 4. This is how you monitor the specific clicks, scrolls, and submissions that show someone is actually engaged. Generic page-view data is just noise; the signal is in the actions.
Here are a few essential events you should be tracking right now:
- Form Submissions: Track every single lead form, contact form, and newsletter signup. If you see a lot of people starting to fill out a form but not finishing, you've just found a major friction point.
- Key Button Clicks: Don't just track who lands on a page. Track who clicks "Add to Cart," "Request a Demo," or "Download Now." These clicks are the real indicators of intent.
- Video Plays: Is your expensive product video actually working? Track how many people hit play, how far they watch, and where they drop off.
- Outbound Link Clicks: See which external resources or partner links your audience is clicking on. It’s a great way to understand what they find valuable.
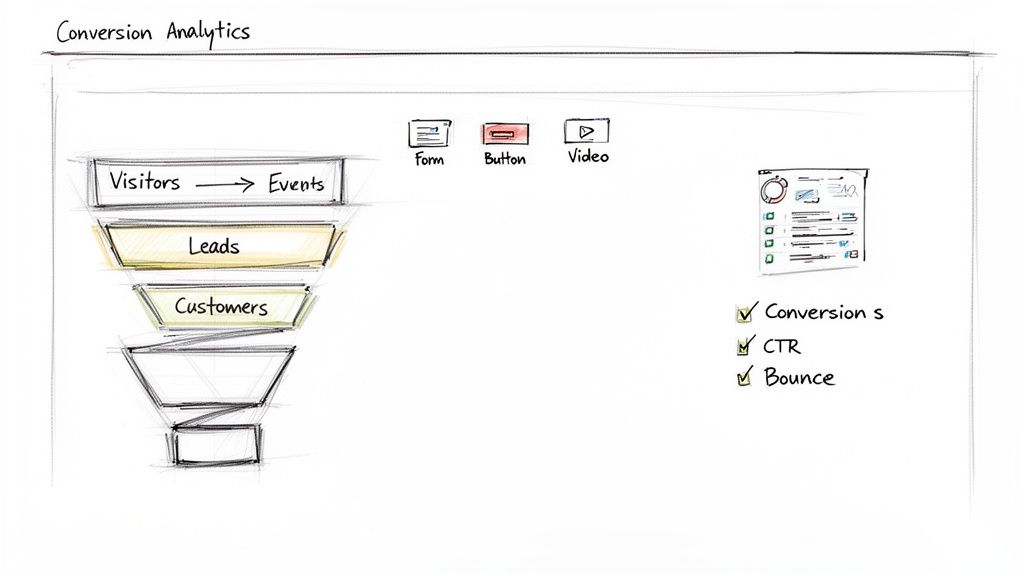
This kind of granular tracking turns your analytics from a passive report into an active diagnostic tool. The image below shows a typical dashboard view, giving you a high-level look at how users are engaging with key events.
A snapshot like this helps you visualize activity over time, letting you spot trends in conversions and engagement that are worth digging into.
Mapping Your Conversion Funnels
Once your event tracking is live, you can start building conversion funnels. A funnel is just a visualization of the steps a user takes to complete a goal, and it's your best friend for finding out where people are abandoning the process.
For an e-commerce store, a classic funnel might look like this:
- Visited Product Page
- Added Item to Cart
- Initiated Checkout
- Completed Purchase
For a SaaS company, it might be the signup and onboarding flow:
- Visited Pricing Page
- Clicked "Start Free Trial"
- Completed Sign-up Form
- Logged in for the First Time
Analyzing these funnels will immediately show you your biggest opportunities. If you see a 70% drop-off between adding an item to the cart and starting the checkout, you know exactly where to focus your attention. For a deeper dive on how to structure this data, check out our guide on applying data pipelines to business intelligence.
A conversion funnel doesn't just show you that you're losing visitors; it shows you where you're losing them. Each drop-off point is a question your users are asking that your website isn't answering clearly enough.
Identifying Your Key Performance Indicators
Finally, you need to be crystal clear on what success actually looks like. That means defining the Key Performance Indicators (KPIs) that matter to your business. To really build a data-driven foundation for CRO, you have to track the right things. This article on CRO KPIs to track is a great starting point.
Generally, these KPIs fall into two buckets:
Macro-Conversions: These are the big wins—the primary goals of your website.
- Making a purchase
- Requesting a quote or demo
- Submitting a lead form
Micro-Conversions: These are the smaller, yet crucial, steps that signal a user is moving in the right direction. They build trust and engagement on the path to a macro-conversion.
- Signing up for a newsletter
- Downloading a whitepaper or case study
- Creating an account
- Watching a product video
Tracking both gives you the full picture. Micro-conversions are often leading indicators, proving that your strategy is working long before the final sale comes through.
Finding the Leaks in Your Conversion Funnel
You've got the analytics foundation set up. Awesome. Now the real detective work begins. Your data tells you where people are dropping off, but to actually boost your website's conversion rates, you need to understand the why. This is where we stop staring at charts and start seeing the website through a real user’s eyes.
This diagnostic phase isn’t about just one tool; it’s about combining two powerful approaches. First, you'll use qualitative tools to watch how people actually behave. Then, you'll cross-reference those observations with your quantitative data to confirm what you’re seeing is a real pattern and not just a fluke.
Seeing Your Site Through Their Eyes
Qualitative tools are your secret weapon for building empathy. They show you all the little moments of frustration, confusion, or hesitation that numbers on a screen could never capture.
Heatmaps: Think of these as a visual report card for your page design. They show you exactly where users are clicking, tapping, and moving their cursors. Are they trying to click on something that isn't a link? Are they completely ignoring that big, beautiful call-to-action button you were so proud of? Heatmaps give you an instant read on what’s catching their attention and what’s being treated like it’s invisible.
Session Recordings: This is like having a DVR for your website. You can watch anonymous recordings of real user sessions, seeing every scroll, click, and mouse movement. You'll see people "rage-clicking" a broken button, endlessly scrolling because they can’t find a piece of information, or giving up on a form halfway through.
Honestly, watching just five or six recordings on a page with a high drop-off rate will often give you more actionable insights than spending hours in a spreadsheet. You’ll spot the usability headaches that are quietly murdering your conversions.
Getting Feedback Straight From the Source
While watching user behavior is powerful, sometimes the quickest way to find out what’s broken is just to ask. Getting direct feedback cuts through all the guesswork.
Don't fall into the trap of assuming you know what your users are thinking. Set up a few simple feedback channels to get real answers.
On-Site Surveys & Polls: Pop up a small, unobtrusive survey on key pages. Ask dead-simple questions like, "What's the one thing stopping you from signing up today?" or "Was there anything you had trouble finding on this page?"
Dive Into Support Tickets: Your customer support team is sitting on a goldmine of user feedback. Go through recent support tickets, live chat transcripts, and even notes from your sales team. Look for recurring questions, complaints, or points of confusion. These are giant red flags pointing to friction in your user journey.
This kind of direct feedback is what connects the dots between the behavior you see in session recordings and the actual thoughts running through your users’ heads.
A simple survey on a checkout page can tell you that people are leaving because of unexpected shipping costs—something a heatmap would never reveal. It’s the combination of observation and direct feedback that leads to those breakthrough "aha!" moments.
Slicing the Data for Deeper Insights
Armed with some qualitative insights, it’s time to go back to your analytics and validate those observations at scale. This is where you confirm whether the problems you spotted are just one-off incidents or widespread issues affecting a significant chunk of your audience.
One of the best ways to do this is with cohort analysis. You'll group users based on shared traits to see how different segments behave. For example, you could compare:
- Mobile vs. Desktop Users: Is your checkout abandonment rate way higher on mobile? That could confirm your hunch that the payment form is a nightmare to use on a small screen.
- New vs. Returning Visitors: Are new visitors bouncing from the homepage while returning visitors know exactly where to go? Maybe your value proposition isn't clear enough for first-timers.
- Traffic Source: Are visitors from a specific Google Ads campaign leaving almost immediately? The ad's message might be creating expectations that your landing page isn't meeting.
By segmenting your data, you can graduate from a generic problem like "our cart abandonment rate is high" to a sharp, data-backed hypothesis like, "The 'Complete Purchase' button isn't visible on mobile viewports under 400px, causing a 40% higher abandonment rate for that specific user segment." That is the kind of specific, testable hypothesis that leads to real conversion lifts.
Fixing Funnel Leaks with Better UX and Copy
Once your diagnostic work has exposed the cracks in your conversion funnel, it’s time to roll up your sleeves and start plugging those leaks. This is the fun part, where your data-backed hypotheses become tangible changes that improve the user experience (UX) and sharpen your website copy.
Think of it as a targeted repair job. You’re not redesigning your entire site on a whim. Instead, you're making precise, impactful fixes to the specific spots—like confusing navigation, painful load times, or weak calls-to-action—that your data showed were killing conversions.
Streamlining the User Journey
One of the most common sources of user frustration is a clunky, confusing, or just plain long process. Every extra click, every unnecessary form field, and every moment of confusion adds friction that can send users running for the exit. Improving your user flows is a powerful way to smooth out these rough patches. For a deeper dive, you can explore some best practices for creating powerful user flows to guide your efforts.
Start by tackling the biggest offenders first.
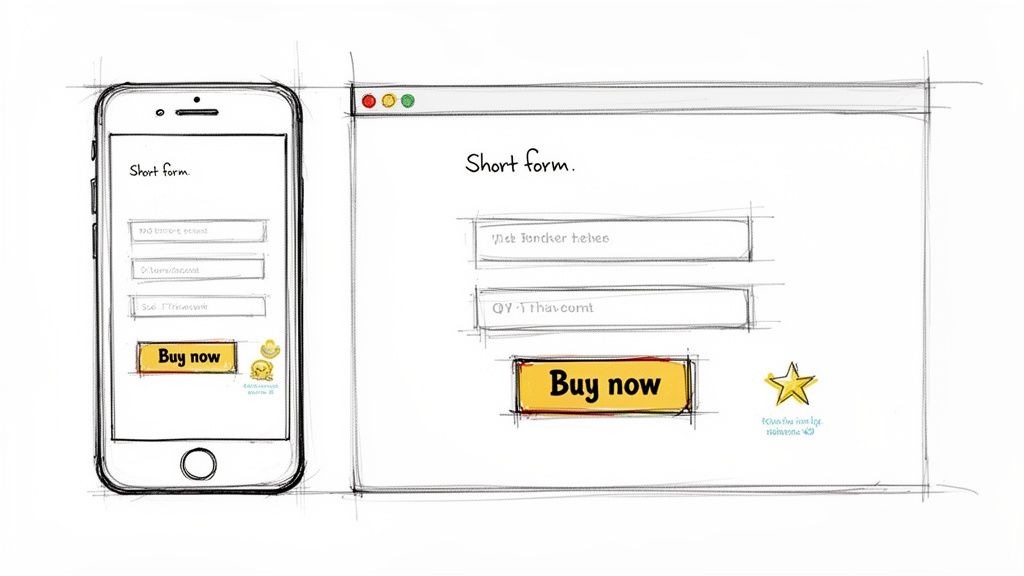
Simplify Your Forms: Is your signup or checkout form asking for a user's life story? Cut it down to the absolute essentials. Study after study has shown that just reducing the number of form fields can dramatically increase completion rates. A user is far more likely to finish a three-field form than a ten-field behemoth.
Improve Site Navigation: If users can't find what they're looking for, they can't convert. It's that simple. Use the insights from your heatmaps and session recordings to simplify your main navigation menu and make sure your most important pages are no more than one or two clicks away from anywhere.
Boost Page Load Speed: We live in an era of instant gratification, and speed is non-negotiable. A slow-loading site is a guaranteed conversion killer. Even a one-second delay in page response can lead to a 7% drop in conversions. Fire up tools like Google PageSpeed Insights to identify and squash whatever is slowing you down.
Crafting Copy That Converts
Your website's copy does more than just describe what you do; it's your 24/7 salesperson. It needs to be clear, persuasive, and relentlessly focused on communicating value from the user's perspective.
Vague headlines and generic CTAs are some of the most common reasons for low conversion rates. Your copy has to immediately answer the user’s most important question: "What's in it for me?"
Takeaway: Persuasive copy isn't about clever wordplay. It's about clarity. It should instantly communicate your value proposition and guide the user confidently toward the next step.
Here are a few quick wins for your copy:
- Write Benefit-Oriented Headlines: Instead of just listing a feature (e.g., "Our Software Has AI Integration"), spell out the benefit ("Automate Your Workflow with AI").
- Make Your CTAs Specific: Ditch generic buttons like "Submit" or "Learn More." Replace them with action-oriented text that tells the user exactly what will happen next, like "Get Your Free Quote" or "Download the Ebook Now."
- Use Social Proof: Weave in testimonials, case studies, and customer logos near key decision points. Seeing that other people have had success with your product builds trust and eases anxiety. For instance, placing a powerful customer quote right below your "Add to Cart" button can be incredibly effective.
Designing for a Mobile-First World
Optimizing for mobile is no longer optional—it's the bare minimum. With the majority of web traffic now coming from mobile devices, a poor mobile experience is a direct path to lost revenue. You absolutely need a responsive design that creates a seamless experience on any screen size.
But here's the thing: user behavior and conversion patterns can be wildly different across devices. E-commerce conversion rates often show that tablets and desktops outperform mobile, despite the sheer volume of mobile shoppers. For example, recent data shows that while personal care products might lead conversions at 6.8%, those rates can swing dramatically depending on whether the purchase happens on a phone or a laptop.
This reality means a "mobile-first" approach is about more than just a responsive layout. It’s about designing an experience that caters to the mobile user’s context—they're often on the go, distracted, and less patient—while still making it easy for them to convert on whatever platform they feel most comfortable with.
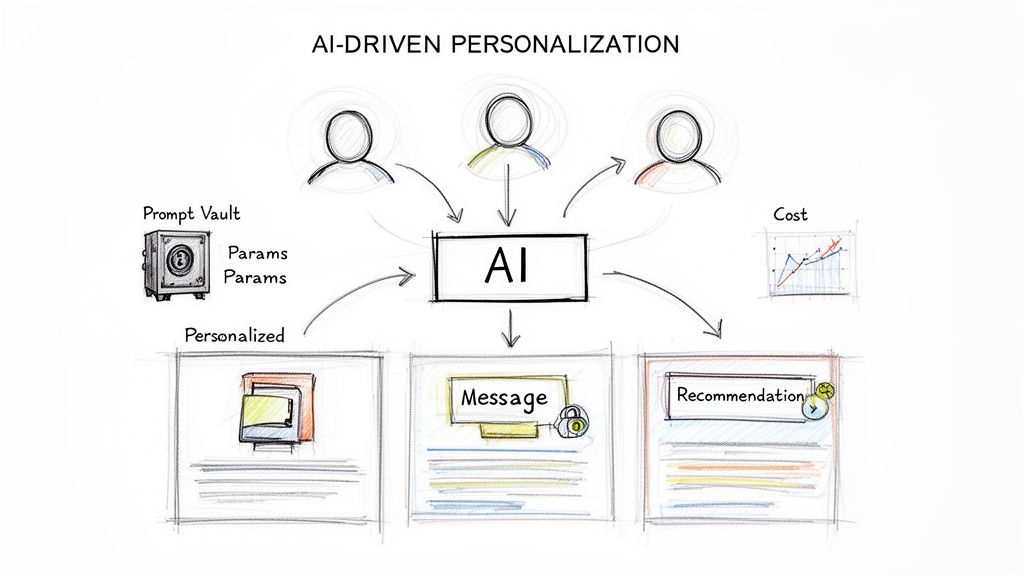
Using AI for Advanced Personalization
Ready to gain a serious competitive edge? Once you’ve patched the most obvious leaks in your funnel, the next level of optimization is moving from a one-size-fits-all experience to one that feels uniquely built for each visitor. This is where AI-driven personalization can completely change the game for your conversion rates.
Instead of hitting every user with the same generic homepage or product grid, AI lets you deliver a unique experience based on their real-time behavior, location, past interactions, and even their likely industry.
This kind of advanced personalization isn't just for industry giants anymore. Integrating these features has become far more accessible for businesses of all sizes looking to get an edge.
How AI Drives Personalized Experiences
Artificial intelligence can analyze massive amounts of user data in milliseconds to predict what someone wants and serve up the most relevant content. This creates a more engaging and frictionless journey for the user, which has a direct impact on your bottom line.
Here are a few practical examples of what this looks like in the real world:
- AI-Powered Product Recommendations: For an ecommerce store, this goes way beyond the basic "people who bought this also bought…" AI can analyze a user's entire browsing history, the items they've lingered on, and profiles of similar users to suggest products they are statistically very likely to purchase next.
- Dynamic Website Content: A SaaS company’s website can adapt in real-time. A visitor from the healthcare industry might see case studies and testimonials from hospitals, while someone from finance sees content tailored to their specific compliance and security needs.
- Personalized Offers and Pricing: AI can spot price-sensitive shoppers and automatically present a small discount or free shipping offer to nudge them toward a purchase. It also knows when not to offer a discount to users who were probably going to buy anyway, protecting your margins.
This level of granular personalization helps you move from simply fixing problems to proactively creating a better, more persuasive user journey. Our guide on ecommerce personalization software offers a deeper look into the tools that make this possible.
The Tools That Make It Happen
Integrating sophisticated AI features might sound like a massive engineering headache, but modernizing your application is more manageable than you think. This is where a robust administrative toolkit, like Wonderment’s prompt management system, becomes a game-changer for both developers and business leaders.
These systems are designed to plug into your existing software, giving you the core infrastructure needed to roll out AI-powered personalization efficiently and safely. By choosing the right developers for your project, you can ensure these powerful tools are integrated seamlessly, allowing your application to scale and last for many years to come.
The goal of AI in CRO isn't just to be clever; it's to be helpful. By anticipating user needs and removing guesswork, you create a hyper-relevant experience that feels less like a sales pitch and more like a conversation.
A well-designed system gives your team the controls to manage AI effectively:
- A Prompt Vault with Versioning: Think of this as a centralized, version-controlled library for all your AI prompts. It ensures that whether the AI is generating a product description or a personalized email, the tone and messaging remain consistent and on-brand.
- A Parameter Manager: This tool gives the AI secure, controlled access to your internal databases. It's how the AI can pull in a user's purchase history or company data to create those hyper-relevant recommendations without compromising data security.
- A Logging System: Get a complete audit trail across all integrated AIs to monitor performance, troubleshoot issues, and ensure compliance.
- A Cost Manager: AI is powerful, but it isn't free. A cost manager provides a real-time dashboard to see your cumulative AI spend, preventing budget surprises and helping you optimize for efficiency.
Using a system like this allows you to modernize your application and deploy sophisticated personalization with confidence. The industry's focus on CRO is clear—conversion rate optimization is now the second-most-utilized technique among marketers, with 50% adoption. While the average e-commerce site converts under 2%, high-performing stores consistently exceed 5%, proving that strategic interventions like AI personalization can yield massive returns. You can discover more insights about these marketing statistics on HubSpot.
Testing and Measuring for Continuous Growth
Optimization isn't a one-time project you can just check off a list. I've seen too many teams make that mistake. True growth comes from a continuous loop of testing, learning, and refining your approach. After you’ve rolled out your initial UX and copy fixes, you have to scientifically validate that the changes actually work. This is where a structured A/B testing plan separates the pros from the amateurs, moving you from making educated guesses to making data-driven decisions that consistently lift your conversion rates.
The real goal here is to build a culture of experimentation. Every change becomes a hypothesis, and every experiment teaches you something valuable about your audience, whether it wins or loses. This iterative process ensures your website is always evolving to better meet what your users actually want and need.
Prioritizing Your Test Ideas
You're going to have a long list of potential changes to test. It happens every time. The key is to prioritize the ones that will deliver the most impact with the least amount of heavy lifting. A simple but incredibly powerful way to do this is with a framework like PIE:
- Potential: How much improvement can we realistically expect from this change? Fixing a broken checkout button has massive potential. Changing the color of a footer link? Not so much.
- Importance: How valuable is the traffic hitting this page? An experiment on your highest-traffic product page is way more important than one on an obscure blog post from five years ago.
- Ease: How difficult is this test to implement, both for your engineers and your marketing team? A simple headline change is far easier than redesigning an entire multi-step checkout flow.
By scoring each idea on these three factors, you can build a prioritized roadmap. This keeps your teams focused on the experiments most likely to actually move the needle, not just the ones that sound interesting.
Understanding Your Test Results
Once a test is live, you need to know when you can actually trust the results. This is where a couple of statistical concepts come into play. You don't need to be a statistician, but you absolutely need to grasp two key terms:
- Statistical Significance: This tells you how likely it is that the difference between your control (the original version) and your variation is because of your changes, not just random chance. Most tools, and most sane marketers, aim for a 95% significance level.
- Confidence Level: Think of this as the probability that your results are repeatable. A 95% confidence level means you can be 95% sure that if you ran the exact same test again, you’d get a similar outcome.
Don’t call a test early just because one version is pulling ahead after a few days. Patience is a virtue in testing. Wait until you have enough data and have reached statistical significance to make a decision you can stand behind.
Knowing your industry benchmarks also provides some much-needed context. For instance, the average conversion rate across fourteen major industries is about 2.9%. Understanding that paid search averages 3.2% while organic search hits 2.7% helps you set realistic goals for your tests and spot which channels have the most room for improvement. If you want to dive deeper, you can find more insights on conversion rate by industry benchmarks.
Common Questions About Website Conversion Rates
When you dive into the world of conversion optimization, a lot of questions pop up. It doesn't matter if you're just getting your bearings or trying to sharpen an existing strategy—getting clear answers is the only way forward. Let's walk through some of the most frequent questions we hear from business leaders and developers alike.
What Is a Good Website Conversion Rate
Everyone wants to know the magic number, but the truth is, it’s complicated. You'll often hear that the average website conversion rate is around 2-5%, but that figure is almost useless without context. It varies wildly depending on your industry, where your traffic is coming from, and what you’re even counting as a "conversion."
Think about it: a niche B2B SaaS company aiming for demo requests will have a completely different conversion landscape than a big e-commerce store selling hot-ticket items.
Instead of getting hung up on a universal benchmark, your real focus should be on establishing your own baseline. A "good" conversion rate is one that’s consistently better than it was last month. That's the only metric that truly matters.
How Long Does It Take to See Results
Sometimes, you get lucky with a quick win. A simple, high-impact fix—like repairing a broken CTA button or drastically simplifying a signup form—can show positive results within days of an A/B test going live. But those are the exceptions, not the rule.
Building a truly effective, data-driven CRO program is a long game. Real, sustainable growth in your conversion rate doesn't happen overnight. It’s the result of a steady cycle of testing, learning, and iterating over several months. You have to be patient and trust the process; it’s all about making small, incremental gains that compound into significant results over time.
Which Tools Are Essential for CRO
You can't just guess your way to better conversions. To do this right, you need a solid stack of tools, each with a specific job:
- Analytics: Something like Google Analytics is non-negotiable. It’s your source of truth for tracking KPIs and understanding your conversion funnels.
- Behavioral Insights: You need to understand the why behind the numbers. Heatmap and session recording tools give you a window into how users are actually interacting with your site.
- Testing: An A/B testing platform is the only way to prove your ideas work. It’s essential for validating your hypotheses with cold, hard data instead of opinions.
- AI Integration: If you're serious about advanced personalization, you’ll need a system to manage your AI prompts and data flows. This is what allows you to scale up your efforts and deliver truly one-to-one experiences.
At Wonderment Apps, we live and breathe this stuff. We specialize in helping businesses modernize their applications with the kind of intelligent, data-powered features that actually move the needle on growth. Our AI modernization services and prompt management tools are designed to give you the foundation for building personalized experiences that convert. We're dedicated to helping business leaders succeed with their software initiatives by showing you how to use AI to build applications that last.
Ready to turn more of your visitors into loyal customers? Schedule a demo with us today and let's talk about how we can help you build a high-performance application that scales with your ambition.