Are you measuring what really matters in your software projects? For years, engineering teams have chased velocity as the be-all and end-all metric, but it’s a number that often fails to tell the whole story about business impact. It's time to shift our focus.
Let's look at a new breed of agile performance metrics that give you a crystal-clear window into team health, delivery speed, and most importantly, the actual value you're shipping to customers. As we'll see, modernizing your software with AI adds a new layer to this, making tools that manage AI integration absolutely essential.
For instance, at Wonderment Apps, we've developed a prompt management system that acts as an administrative tool for developers and entrepreneurs. It plugs into your existing app to modernize it for AI, providing a prompt vault, a parameter manager, and even a cost manager to see your cumulative spend. It's this kind of administrative layer that makes tracking modern metrics possible. Let's dive in!
Moving Beyond Velocity With Smarter Metrics

This guide is all about the modern metrics that top-performing teams are using to not just work faster, but work smarter. We'll also see how today’s more sophisticated tools are becoming absolutely essential for this new, more nuanced approach.
Think about it: as more teams bring AI into their workflow, a solid prompt management system isn't just a 'nice-to-have' anymore. It becomes critical for controlling, versioning, and tracking the cost of AI-driven features, which feeds directly back into your performance data. The old ways just don't cut it.
So, let's dive into the metrics that finally connect your team's hard work to your company's strategic goals.
What’s the Point of Agile Metrics, Anyway?
Agile metrics are far more than just numbers on a dashboard. They’re the vital signs of your entire development process. They give you the objective feedback you need to see how efficiently work is flowing, pinpoint exactly where the bottlenecks are, and make decisions based on data, not just gut feelings.
Without them, you’re basically flying blind.
These data points show you in real-time whether your processes are actually working and delivering genuine value. It’s a huge shift in thinking, and it’s paying off across the industry. Recent data shows that 39% of organizations using Agile report the highest average project performance, hitting an overall project success rate of 75.4%. The proof is in the pudding.
Key Agile Metric Categories At a Glance
To truly get past the limitations of velocity, you have to start measuring team productivity effectively by focusing on meaningful outcomes, not just output. A balanced approach means looking at several different categories of metrics. Each one answers a different—but equally critical—question about your team’s performance.
The table below breaks down the core categories you should be thinking about.
| Metric Category | Primary Focus | Key Questions Answered |
|---|---|---|
| Flow and Delivery | The speed and efficiency of your pipeline | "How fast can we deliver value from idea to customer?" |
| Quality and Stability | The reliability and robustness of software | "Are we building things right? Is our product stable?" |
| Business Outcome | The real-world impact of your development | "Are we building the right things? Does anyone care?" |
| Team Health | The well-being and sustainability of the team | "Can our team keep performing at this level without burnout?" |
Looking at these areas together gives you a complete, 360-degree view. It stops you from accidentally optimizing one part of the system at the expense of another—like shipping features faster but seeing your bug count skyrocket.
This balanced view is the real foundation of a healthy, high-performing agile environment.
Understanding the Four DORA Metrics
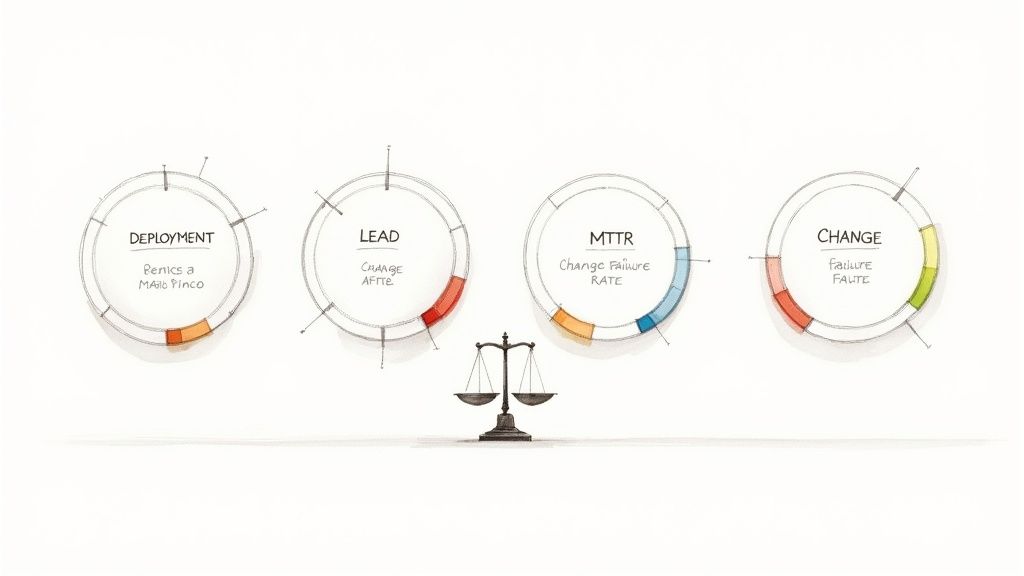
If flow metrics give you a peek inside your team’s workshop, DORA metrics show what happens when the product hits the open road. These four metrics, developed by the DevOps Research and Assessment (DORA) team at Google, have quickly become the gold standard for measuring how well a high-performing software team actually delivers.
Think of them as the critical gauges on your car's dashboard. Two of them measure your speed (throughput), while the other two track your car's reliability (stability). Elite teams know you can’t have one without the other. Flooring the accelerator is pointless if the engine is about to fall out. DORA metrics provide this crucial balance, giving you the complete picture of your delivery health.
Measuring Speed and Throughput
The first two DORA metrics are all about how quickly your team can get valuable changes into the hands of your users. They are the ultimate pulse check on your development engine's velocity and responsiveness.
- Deployment Frequency: This is pretty straightforward: how often does your team successfully release code to production? Are we talking multiple times a day, once a week, or maybe just once a month? Think of it as the number of delivery trucks leaving your factory. Top-tier teams ship out lots of small, frequent deliveries, which lowers risk and gets value to customers much faster.
- Lead Time for Changes: This tracks the total time it takes from the moment a developer commits code to that code being successfully deployed in production. It’s the entire journey a change takes through your delivery pipeline. A short lead time is a clear sign that your process is efficient, automated, and free of frustrating bottlenecks.
These two metrics together tell a powerful story about your team's agility. A high deployment frequency paired with a short lead time for changes points to a healthy, streamlined system. It shows your team has mastered automation and can react to market needs almost instantly. This kind of efficiency is often the result of a well-oiled process, and you can learn more about building one with these CI/CD pipeline best practices.
Measuring Quality and Stability
Speed is great, but it’s completely worthless if your deployments are constantly breaking things. The next two DORA metrics are your system’s reliability and safety checks, making sure you're not just moving fast, but moving safely.
These stability metrics are your guardrails. They stop you from accelerating so fast you drive right off a cliff. They ensure that with every boost in speed, you maintain—or even improve—the quality and reliability your users depend on.
- Change Failure Rate (CFR): This metric keeps an eye on the percentage of your deployments that cause a failure in production. A "failure" could be anything from a full-blown service outage to a performance dip or a bug that demands an immediate fix like a rollback. A low CFR is a strong signal of quality engineering, solid testing, and a dependable deployment process. The best teams typically see a CFR of 0-15%.
- Mean Time to Recovery (MTTR): Let's be realistic—failures will happen, no matter how good your team is. The real difference between elite performers and everyone else is how quickly they can bounce back. MTTR measures the average time it takes to restore service after something goes wrong in production. A low MTTR shows your team has excellent monitoring, effective incident response plans, and the ability to diagnose and fix issues under pressure. Elite teams can often recover from an incident in less than an hour.
Taken together, these four agile performance metrics give you a balanced, holistic view of your engineering muscle. They shift the conversation away from vague feelings of "being busy" and anchor it in hard data about both speed and stability. By tracking them, you can zero in on areas for improvement and guide your team toward truly elite performance.
Getting Smart About Your Workflow with Flow Metrics
Is your team’s workflow a smooth-flowing river or a frustrating traffic jam? Picture a busy restaurant kitchen. Orders are piling up, chefs are scrambling, and hangry customers are waiting. To bring order to that chaos, you need real-time data on what’s actually happening on the line.
In that kitchen, every dish moves through stations: prep, cook, plate. Each step is a chance to speed things up or, more often, a place where things can grind to a halt. Agile performance metrics are like the head chef's cheat sheet, showing exactly where work stalls, where waste is happening, and where to focus your attention.
The Core Flow Metrics That Matter
When you boil it down, there are three core metrics borrowed from Lean and Kanban that tell you almost everything you need to know:
- Cycle Time: This tracks how long it takes to complete a task from the moment someone starts working on it until it's finished.
- Throughput: This simply measures how many items your team completes in a specific period, like a week or a sprint.
- Work in Progress (WIP): This is a headcount of all the tasks your team is juggling at any given moment.
Think of these three metrics as the heartbeat of your delivery pipeline. They’ll tell you if orders are getting cold on the pass or if your cooks are standing around waiting for ingredients.
Calculating Cycle Time and Throughput
Getting a handle on Cycle Time is straightforward: just subtract the start time from the finish time. If a task moves to “in progress” at 10:00 AM and is marked “done” at 12:30 PM, its cycle time is 2.5 hours.
Throughput is just as easy. It’s the total number of items finished over a set period. If your team knocks out 20 tickets in a five-day work week, your throughput is 4 tickets per day.
| Metric | Definition | Good Target |
|---|---|---|
| Cycle Time | Time from "start" to "finish" | < 3 days |
| Throughput | Completed items per day or sprint | Steady upward trend |
| WIP | Active items at once | < 5 per person/team |
These aren't rigid rules, but they’re solid benchmarks that guide teams toward predictable delivery without causing burnout. They give you the data you need to know when it’s time to tweak a process or shift resources around.
Spotting Bottlenecks in Your Kitchen
“Flow metrics shine a light on hidden delays, helping teams turn chaos into a calm, steady stream of value.”
When you see cycle time spiking or your WIP count ballooning, that’s your signal to investigate. Maybe your code review process is understaffed, or perhaps stakeholder approvals are taking way too long. Addressing these choke points could be as simple as adding another reviewer or streamlining a handoff.
Here’s a simple way to get started:
- Visualize Your Process: Get your workflow up on a board where everyone can see it.
- Limit WIP: Set explicit caps on how much work can be in any one stage at a time.
- Track Cycle Time and Throughput: Make these numbers visible and review them daily.
- Review the Metrics: Talk about them in your standups or retrospectives.
When you track flow metrics consistently, patterns start to jump out. You’ll stop guessing where the problem is—you’ll know.
A Quick Case Study
A small marketing team at WonderMart noticed their cycle time for new campaign assets had jumped from 1 day to 3 days after they added a few extra review steps. The team started tracking their WIP daily on a whiteboard and quickly saw where tasks were getting stuck.
They decided to limit their active WIP to just 3 items and cut out one of the redundant approval steps. Within a week, they saw a 20% boost in their throughput. Their pipeline was flowing smoothly again. This real-world tweak shows just how powerful monitoring Cycle Time, Throughput, and WIP can be for finding and fixing process pain points.
Bringing It All Together with AI
Manually tracking all this data can be a pain. You risk working with outdated dashboards and missing important signals. This is where modern teams start to automate metric collection and analysis, and it’s also where a solid prompt management system like Wonderment’s becomes so important.
Our platform helps you integrate AI into your workflow without losing control or visibility. We offer:
- A Prompt Vault with versioning to keep your AI interactions consistent and effective.
- A Parameter Manager to securely connect prompts to your internal data sources.
- A Logging System that records every AI call, so you have a full audit trail.
- A Cost Manager to keep an eye on your spending across different AI models.
By integrating these features directly into your delivery pipeline, you get a clear view of AI-assisted tasks right alongside your core flow metrics. Imagine dashboards that update in real-time, showing cycle times for both human-led and AI-generated work.
You can plug Wonderment’s system into the tools you already use, reducing manual effort and ensuring your data is always reliable. You’ll see AI spending trends and performance data in one unified view, helping you balance the cost of innovation against your actual delivery speed. You can even book a demo of our prompt vault and parameter manager today.
Optimizing for a continuous flow of value is a journey, not a destination. Start small, iterate often, and let the data guide your every move.
Connecting Agile Metrics to Business Outcomes
Shipping new code quickly matters, but are those features really driving value? Busy teams can rack up story points and velocity, yet still miss the bigger picture.
Raw numbers—velocity, throughput—reveal capacity. They don’t show if users stayed longer, clicked more, or paid up.
Linking developer output directly to business targets is the final leg in a mature metrics playbook. It turns engineering into a clear ROI story—each sprint aimed at growth, retention, profitability.
From Outputs To Outcomes: A Critical Shift In Mindset
An output is what you deliver—a redesigned dashboard, a revamped API. An outcome is the ripple effect—higher engagement, fewer churned customers.
For instance:
- Launching a new checkout flow (output)
- Observing a 5% bump in conversion rate (outcome)
This change of lens reshapes conversations. Instead of “How many story points did we finish?” teams ask, “Did this improve user behavior?”
The move toward agile performance metrics reflects this. Companies that make this leap see real benefits:
- 93% report better customer satisfaction
- 59% say collaboration has improved
- 57% find their work aligns more closely with business goals
You can discover more about these agile trend predictions and how they shape modern development.
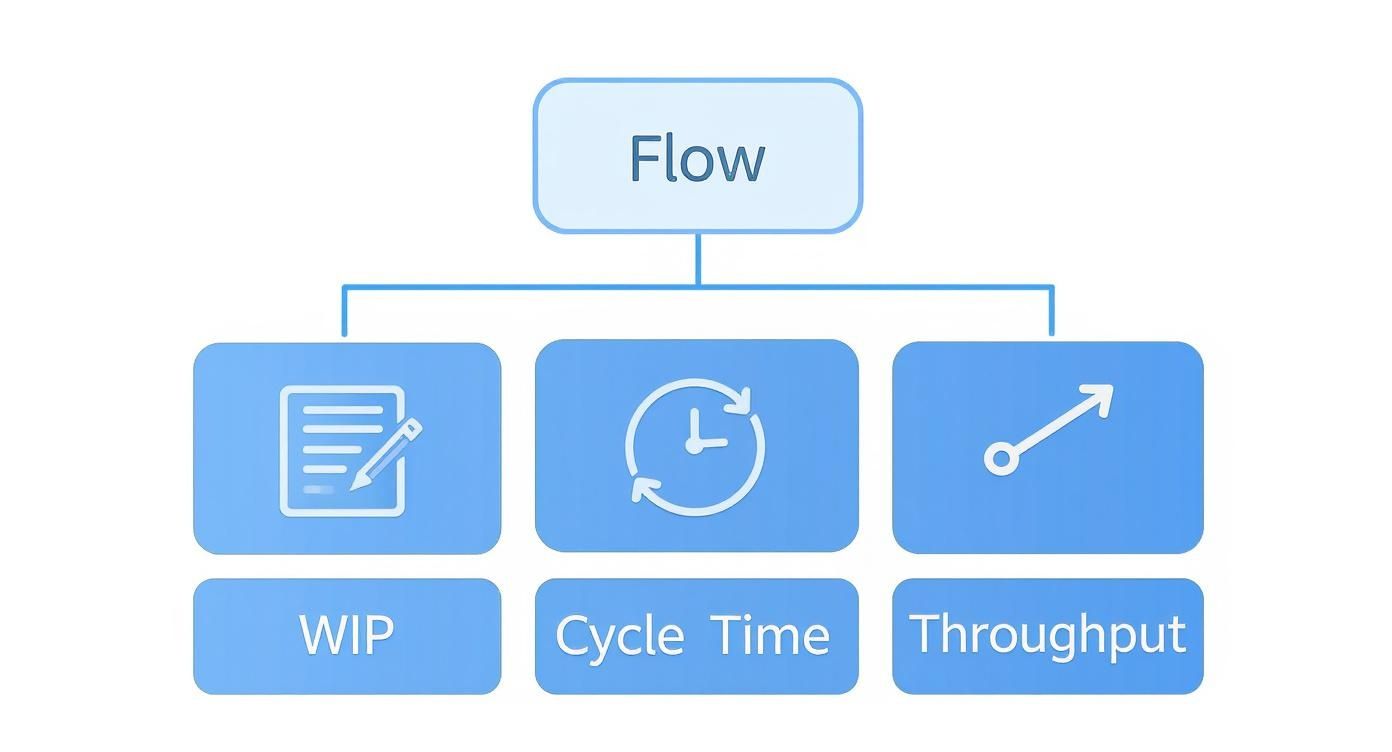
This diagram lays out the three core flow metrics—Work In Progress (WIP), Cycle Time, Throughput. Mastering these is your first step toward reliable delivery and, ultimately, measurable outcomes.
Using OKRs To Bridge The Engineering-Business Gap
Objectives and Key Results (OKRs) offer a straight path from corporate vision down to daily tickets.
OKRs translate broad business goals into specific targets for engineering. They give every feature, bug fix, and refactor a clear “why.”
Here’s a roadmap:
- Company Objective: Grow Q3 recurring revenue by 10%
- Product Team KR: Raise trial-to-paid conversion from 15% to 20%
- Engineering Initiative: Deliver a redesigned onboarding flow
- Business Metric: Trial-to-paid conversion rate
- Agile Metric: Cycle Time for onboarding work
With this alignment, development speed (Cycle Time) ties directly to a key business indicator (conversion rate). If conversion climbs, ROI is proven. If it stalls, you know exactly where to adjust.
For more on this, explore how high-performing tech teams and top product managers build success.
Tying It All Together With Real-World Examples
Let’s walk through a couple of scenarios:
-
Boosting Adoption
A SaaS vendor tracks user adoption rate and engineering monitors Throughput on updates and bug fixes. If Throughput is high but adoption lags, it’s a red flag to revisit the feature’s design. -
Elevating Customer Satisfaction
An e-commerce site spots a dip in Net Promoter Score (NPS). Support data points to slow page loads as the culprit. The team zeroes in on performance, tracking Lead Time for Changes and speed metrics. As they shave off lead time and page load durations, NPS nudges back up.
Bridging agile metrics with business goals shifts engineering from a support role into a growth engine. It arms leaders with data to back investment decisions, celebrate real wins, and steer strategy with confidence.
Modernizing Your Metrics with AI and Automation
Let’s be honest, manual metric tracking is broken. It’s not just tedious; it’s a recipe for outdated insights and human error. Spending hours sifting through Jira tickets, CI/CD logs, and support requests just to populate a spreadsheet is a slow crawl. By the time you’ve finally compiled the data, it's a rearview mirror perspective. The moment to act has already passed.
Modern teams are flipping this model on its head with automation and AI. The goal isn’t just to collect data faster—it's about transforming that data into predictive, real-time intelligence. This means integrating your entire toolchain to create dynamic dashboards that give everyone from individual developers to the C-suite an accurate, up-to-the-minute view of engineering health.
This isn’t just a trend; it's becoming standard practice. The adoption of frameworks like the Scaled Agile Framework (SAFe) is projected to jump from 37% in 2021 to 53% by 2025. This growth is fueled by the need for standardized, scalable measurement, pushing teams toward automation and analytics as core parts of their workflow. You can learn more about the latest State of Agile report findings to see how the industry is adapting.
Preparing Your Application for AI Integration
As you begin to modernize your metrics, integrating AI into your application's features and internal processes becomes the next logical step. But this adds a whole new layer of complexity to your performance data. How do you track the cost of AI model usage? Or measure the true impact of an AI-assisted feature on user satisfaction or your team's cycle time?
This is precisely where a dedicated prompt management system becomes mission-critical. Before you can even begin to measure the impact of AI, you need a solid administrative layer to control, monitor, and manage how it's integrated into your software. Without it, you’re flying blind, completely unable to connect AI costs and performance back to tangible business outcomes.
A prompt management system is the control panel for your AI initiatives. It provides the governance and visibility needed to scale AI responsibly, ensuring your innovation is both effective and cost-efficient.
This administrative control is the missing link for so many teams. It’s what ensures that as you embrace AI, your agile performance metrics actually reflect the true cost and value of that innovation.
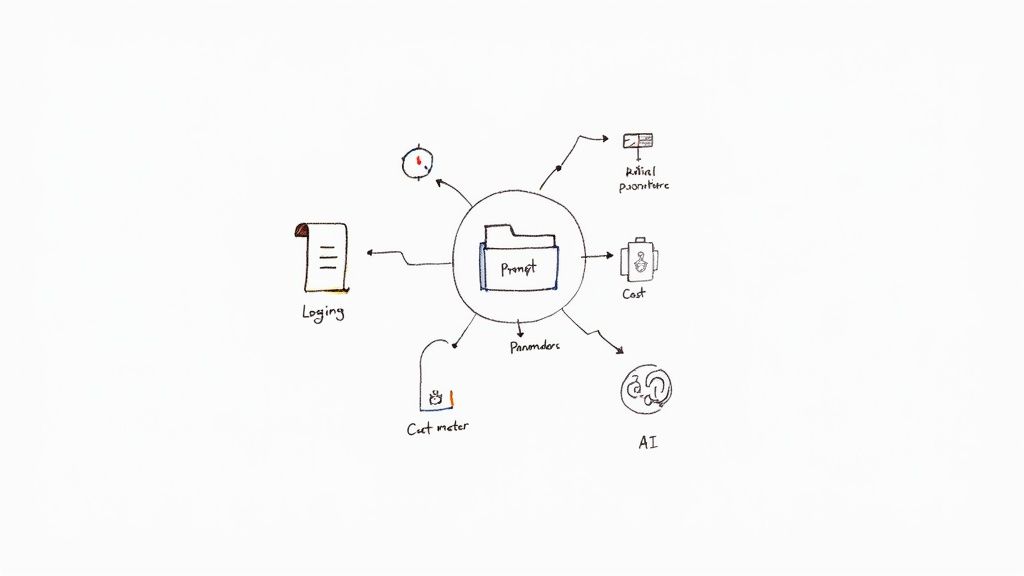
The Role of a Prompt Management System
A platform like Wonderment provides the critical infrastructure to manage AI at scale, giving you the data needed for a complete performance picture. Think of it as an administrative toolkit that plugs directly into your application, offering centralized control over every AI interaction.
Here’s what a comprehensive system should give you:
- A Prompt Vault with Versioning: This is your single source of truth for storing, testing, and versioning prompts. It ensures consistency and lets you track which versions deliver the best results.
- A Parameter Manager: A secure way to connect your prompts to internal databases and APIs. This allows your AI models to access the right data without ever compromising security.
- A Comprehensive Logging System: Captures every single AI interaction, providing a full audit trail for performance analysis, debugging, and compliance.
- A Cost Manager: Monitors your cumulative spend across different AI models. This gives you a crystal-clear view of operational costs and helps you optimize usage on the fly.
By centralizing these functions, you can finally start answering crucial questions like, "Which AI-powered feature is giving us the best ROI?" or "How is our token spend trending against our new feature adoption?" For a deeper dive, check out our guide on how SaaS companies are using AI to improve their products. This level of insight is fundamental to modernizing not just your application, but your entire approach to measuring performance.
Common Metric Pitfalls and How to Avoid Them
Metrics are powerful tools, but in the wrong hands, they can quickly become weapons. When you misuse even the most well-intentioned agile performance metrics, you can create a culture of fear, torpedo team morale, and drive behaviors that are the exact opposite of what you want. The whole point is to illuminate, not intimidate.
Let's walk through the most common traps and anti-patterns that derail engineering teams. Getting a handle on these pitfalls is the first step toward building a healthy, data-informed culture where numbers serve the team's improvement, not individual blame.
Weaponizing Data and Comparing Individuals
The absolute fastest way to destroy psychological safety is to turn metrics into a leaderboard. Publicly ranking developers by story points, bugs fixed, or lines of code is a classic anti-pattern that encourages all the wrong things. It pits teammates against each other, kills collaboration, and just begs people to game the system.
You'll see developers rush through work just to boost their throughput, leaving a trail of technical debt for someone else to clean up. Or they'll start dodging complex but critical tasks, opting for easy wins that inflate their numbers.
Metrics should be a flashlight, not a hammer. Use them to shine a light on systemic problems and find opportunities for the team to grow together. Never use them to single out or punish individuals.
Focusing on a Single Metric in Isolation
Obsessing over one number, like velocity, is another classic mistake. Sure, a team might crank up its velocity sprint after sprint, and that chart will look fantastic. But without the surrounding context, that number can be dangerously misleading.
Is velocity going up because the team is genuinely getting more efficient, or are they just cutting corners on quality to move faster? A rising velocity paired with a spiking Change Failure Rate tells a completely different, much scarier story—one of growing instability and risk. You need a balanced dashboard to see the whole picture.
Here are a few red flags to watch for:
- Velocity Obsession: Chasing a higher story point count without a thought for the impact on quality or system stability.
- Cycle Time Fixation: Pushing to shrink cycle time at all costs, which often leads to rushed code reviews and a flood of new defects.
- Zero-Defect Dogma: Striving for zero bugs sounds noble, but it can stifle innovation and make teams so cautious that delivery slows to a crawl.
Of course, none of this matters if your data is unreliable. The bedrock of any good metrics program is trust in the numbers themselves, so it's critical to avoid common data integrity problems that can poison your analysis and lead you to the wrong conclusions.
Metric Anti-Patterns and Healthy Alternatives
It's easy to fall into bad habits with metrics, but recognizing them is half the battle. Many organizations start with good intentions but end up creating a culture of fear by misapplying the data.
Here’s a look at some common anti-patterns and how to flip them into something constructive.
| Common Anti-Pattern (What to Avoid) | Negative Consequence | Healthy Alternative (What to Do Instead) |
|---|---|---|
| Using velocity or throughput to compare individual developers or teams. | Fosters unhealthy competition, encourages story point inflation, and punishes teams working on complex tasks. | Use these metrics as a team-level capacity planning tool. Look at trends over time to spot systemic bottlenecks, not to rank people. |
| Setting rigid, top-down targets for specific metrics (e.g., "Increase velocity by 10%"). | Teams will hit the target but often by sacrificing quality, ignoring technical debt, or simply gaming the numbers. | Let the team set their own improvement goals based on their retrospectives. Focus on the outcome (e.g., "reduce release friction"). |
| Punishing the team for a dip in a metric, like a drop in deployment frequency or a rise in CFR. | Creates a culture of fear where people hide mistakes and are afraid to experiment or take risks. | Treat metric dips as learning opportunities. Ask "why" in a blameless retrospective to understand the root cause and learn from it. |
| Obsessing over one metric (like cycle time) while ignoring others (like defect escape rate). | Creates a "local optimization" where improving one area causes problems elsewhere, like shipping buggy code faster. | Use a balanced dashboard (like DORA metrics) to see the trade-offs. Understand that improving one metric might temporarily affect another. |
Ultimately, the goal is to shift from using metrics as a report card to using them as a conversation starter. When a number looks off, the first question shouldn't be "Who is to blame?" but rather, "What is this telling us about our process?"
Frequently Asked Questions About Agile Metrics
Moving toward a data-informed approach in agile development always kicks up a few practical questions. As your teams start shifting from gut feelings to objective data, it’s completely natural to wonder about the specifics of how to make it work and what it means for your culture. Let’s tackle some of the most common questions we hear.
How Do We Start Tracking Metrics Without Overwhelming the Team?
The trick is to start small and zero in on value. Whatever you do, don't try to track all 17 possible metrics on day one—that's a recipe for confusion and burnout. Instead, pick just two or three that directly address a specific pain point your team is wrestling with right now.
For instance, if your sprints feel unpredictable and chaotic, start by tracking Cycle Time and Throughput. These are simple flow metrics, easy to get a handle on, and they can quickly shine a light on where the bottlenecks are. The best way to introduce them is during a retrospective. Frame it as a team experiment, positioning the metrics as tools to help everyone, not as a way to pass judgment.
Which Agile Metric Is the Most Important?
Honestly, there isn't one. The idea of a single "most important" metric is a myth. The best metric is the one that helps you improve what you're currently focused on. A balanced dashboard that tells a complete story is infinitely more powerful than obsessing over a single number.
Think of it like this:
- Want to improve speed? Look at Lead Time for Changes.
- Need to improve stability? Focus on your Change Failure Rate.
- Trying to get more predictable? Keep an eye on Throughput.
The DORA metrics are a fantastic framework because they already give you this balance, covering both speed and stability right out of the box. The real goal is to understand how different metrics play off each other to get a complete picture of your team's performance.
How Can We Ensure Metrics Aren't Used to Punish People?
This is all about culture, and it's probably the most critical piece to get right. It's up to leadership to set the tone from the very beginning. You have to consistently frame metrics as tools for improving the system, not for evaluating individuals.
Metrics are for understanding the process, not judging the people. The conversation should always be, "What is this number telling us about our workflow?" and never, "Why is your number lower than theirs?"
Establish clear, non-negotiable ground rules from the start. Make it explicit that metrics will never, ever be used in performance reviews or to create league tables comparing teams. When a metric takes a dip, treat it like a curious puzzle the team can solve together in a blameless retrospective. This builds the psychological safety you need for a healthy, truly data-informed culture to thrive.
Ready to modernize your software with AI and gain full control over your performance metrics? Wonderment Apps has developed a powerful prompt management system that serves as an administrative toolkit you can plug into your existing app. Our platform includes a Prompt Vault with versioning, a secure Parameter Manager for internal database access, a logging system across all integrated AIs, and a Cost Manager to monitor your cumulative spend.
Book a demo of our prompt management system today and see how you can build intelligent, scalable applications with clarity and confidence.